
Beat-to-beat continuous blood pressure estimation with optimal feature set of PPG and ECG signals using deep recurrent neural networks
 0
0 , ...
, ... Abstract
Aim: Continuous blood pressure (BP) monitoring can provide invaluable information for cardiovascular disease (CVD) diagnosis. The purpose of this study is to develop a deep recurrent neural network (RNN) model with an optimal feature set of photoplethysmogram (PPG) and electrocardiogram (ECG) signals for continuous BP estimation.
Methods: This paper presents a novel deep recurrent neural network (RNN), which consists of 2-layered bidirectional Long Short-term Memory (Bi-LSTM) and 6-layered LSTM networks. It is used to estimate BP based on the optimal feature set of PPG and ECG signals. In this work, the optimal feature set is determined using five different feature selection methods.
Results: The proposed method is evaluated based on 660 subjects from the University of California Irvine (UCI) machine learning repository. The RNN model with optimal feature set achieved root mean square error (RMSE) of 3.223 and 1.781 mmHg for systolic BP (SBP) and diastolic BP (DBP), respectively. It also showed mean absolute error (MAE) of 2.514 and 1.383 mmHg for SBP and DBP, respectively. Regarding the British Hypertension Society (BHS) standard, the results attained grade A for the estimation of SBP and DBP.
Conclusion: The experimental results suggest that the proposed deep RNN model with an optimal feature set can improve the performance of BP prediction. Thus, it is possible to further apply our proposed method to develop a wearable device for real-time BP monitoring.
Keywords
INTRODUCTION
According to the World Health Organization (WHO), hypertension has remained one of the leading causes of morbidity and mortality worldwide[1,2]. Hypertension, as one of the major causes of cardiovascular disease, is often asymptomatic in the early stage and thus has a low diagnosis rate[3]. Therefore, continuous and stable monitoring of blood pressure is essential for preventing cardiovascular diseases[4]. Blood pressure (BP) refers to the force exerted on the walls of blood vessels by the flow of blood caused by the heartbeat and serves as a critical indicator of cardiovascular health. An electrocardiogram (ECG) is a noninvasive diagnostic procedure that captures and records the electrical activity of the heart. By analyzing the ECG signals, it becomes possible to observe the electrical activity of the heart, which is closely linked to changes in blood pressure[5]. Photoplethysmographic volumetric tracing (PPG) is an optical technique that captures volumetric tracings, allowing for the detection of changes in blood volume within the small blood vessels within the tissues. The formation of PPG signals is closely correlated with blood pressure and can reflect a wealth of information about cardiovascular function. The combination of ECG and PPG computations can yield various physiological indicators, such as Pulse Arrival Time (PAT), Pulse Transmission Time (PTT), and Pulse Wave Velocity (PWV), which are highly correlated with blood pressure. Therefore, the combination of ECG and PPG signals plays a crucial role in predicting and managing blood pressure for healthcare purposes[6].
There are two main methods used for blood pressure measurement: the invasive method and the noninvasive method. The invasive method is widely regarded as the gold standard for blood pressure (BP) measurement[7]. Compared to the noninvasive cuff-based method, cuffless approaches can easily obtain individual continuous blood pressure in different situations. There have been several recent methods for cuffless BP estimation, including PTT model[8], PTT and photoplethysmogram intensity ratio (PIR) model[9] and machine learning (ML) models, such as support vector regression[10], random forest regression[4] and Gaussian process regression (GPR)[1]. In addition, a model based on convolutional neural networks (CNN) for extracting feature vectors and using LSTM to capture temporal dependencies was proposed in[11]. A complete BP estimation model contains two parts: feature extraction and model fitting. However, with the increasing number of features, the computational cost and model complexity will be increased. Conversely, the smaller number of features may not be able to extract enough information, leading to a poor performance of the BP estimation model. It is hard to say the feature set is optimal if only a specific number of features were used. Hence, the development of a feature selection system becomes crucial to identify the optimal feature set for accurate blood pressure estimation.
In this paper, we introduce a novel beat-to-beat blood pressure (BP) monitoring technique that combines a feature selection system with a deep recurrent neural network (RNN). The RNN architecture comprises a 2-layered bidirectional long short-term memory (Bi-LSTM) network and a 6-layered LSTM network. A total number of 28 features were first extracted from all PPG and ECG beats. Then, a proposed feature voting system consisting of five feature selection methods was applied to select the optimal feature sets. Subsequently, the proposed RNN model was used to estimate DBP, SBP, and MBP. We evaluated the performance of our proposed model using the University of California Irvine (UCI) dataset as the benchmark. Our proposed model shows a better performance than other previously formally published models for BP estimation.
The remainder of the paper is structured as follows: Section “METHODOLOGY” provides the feature extraction, feature selection methods, and the architecture of the RNN model. Section “RESULTS” shows the data and results of our proposed model. In Section “DISCUSSION”, we conclude the paper and outline potential avenues for future research.
METHODOLOGY
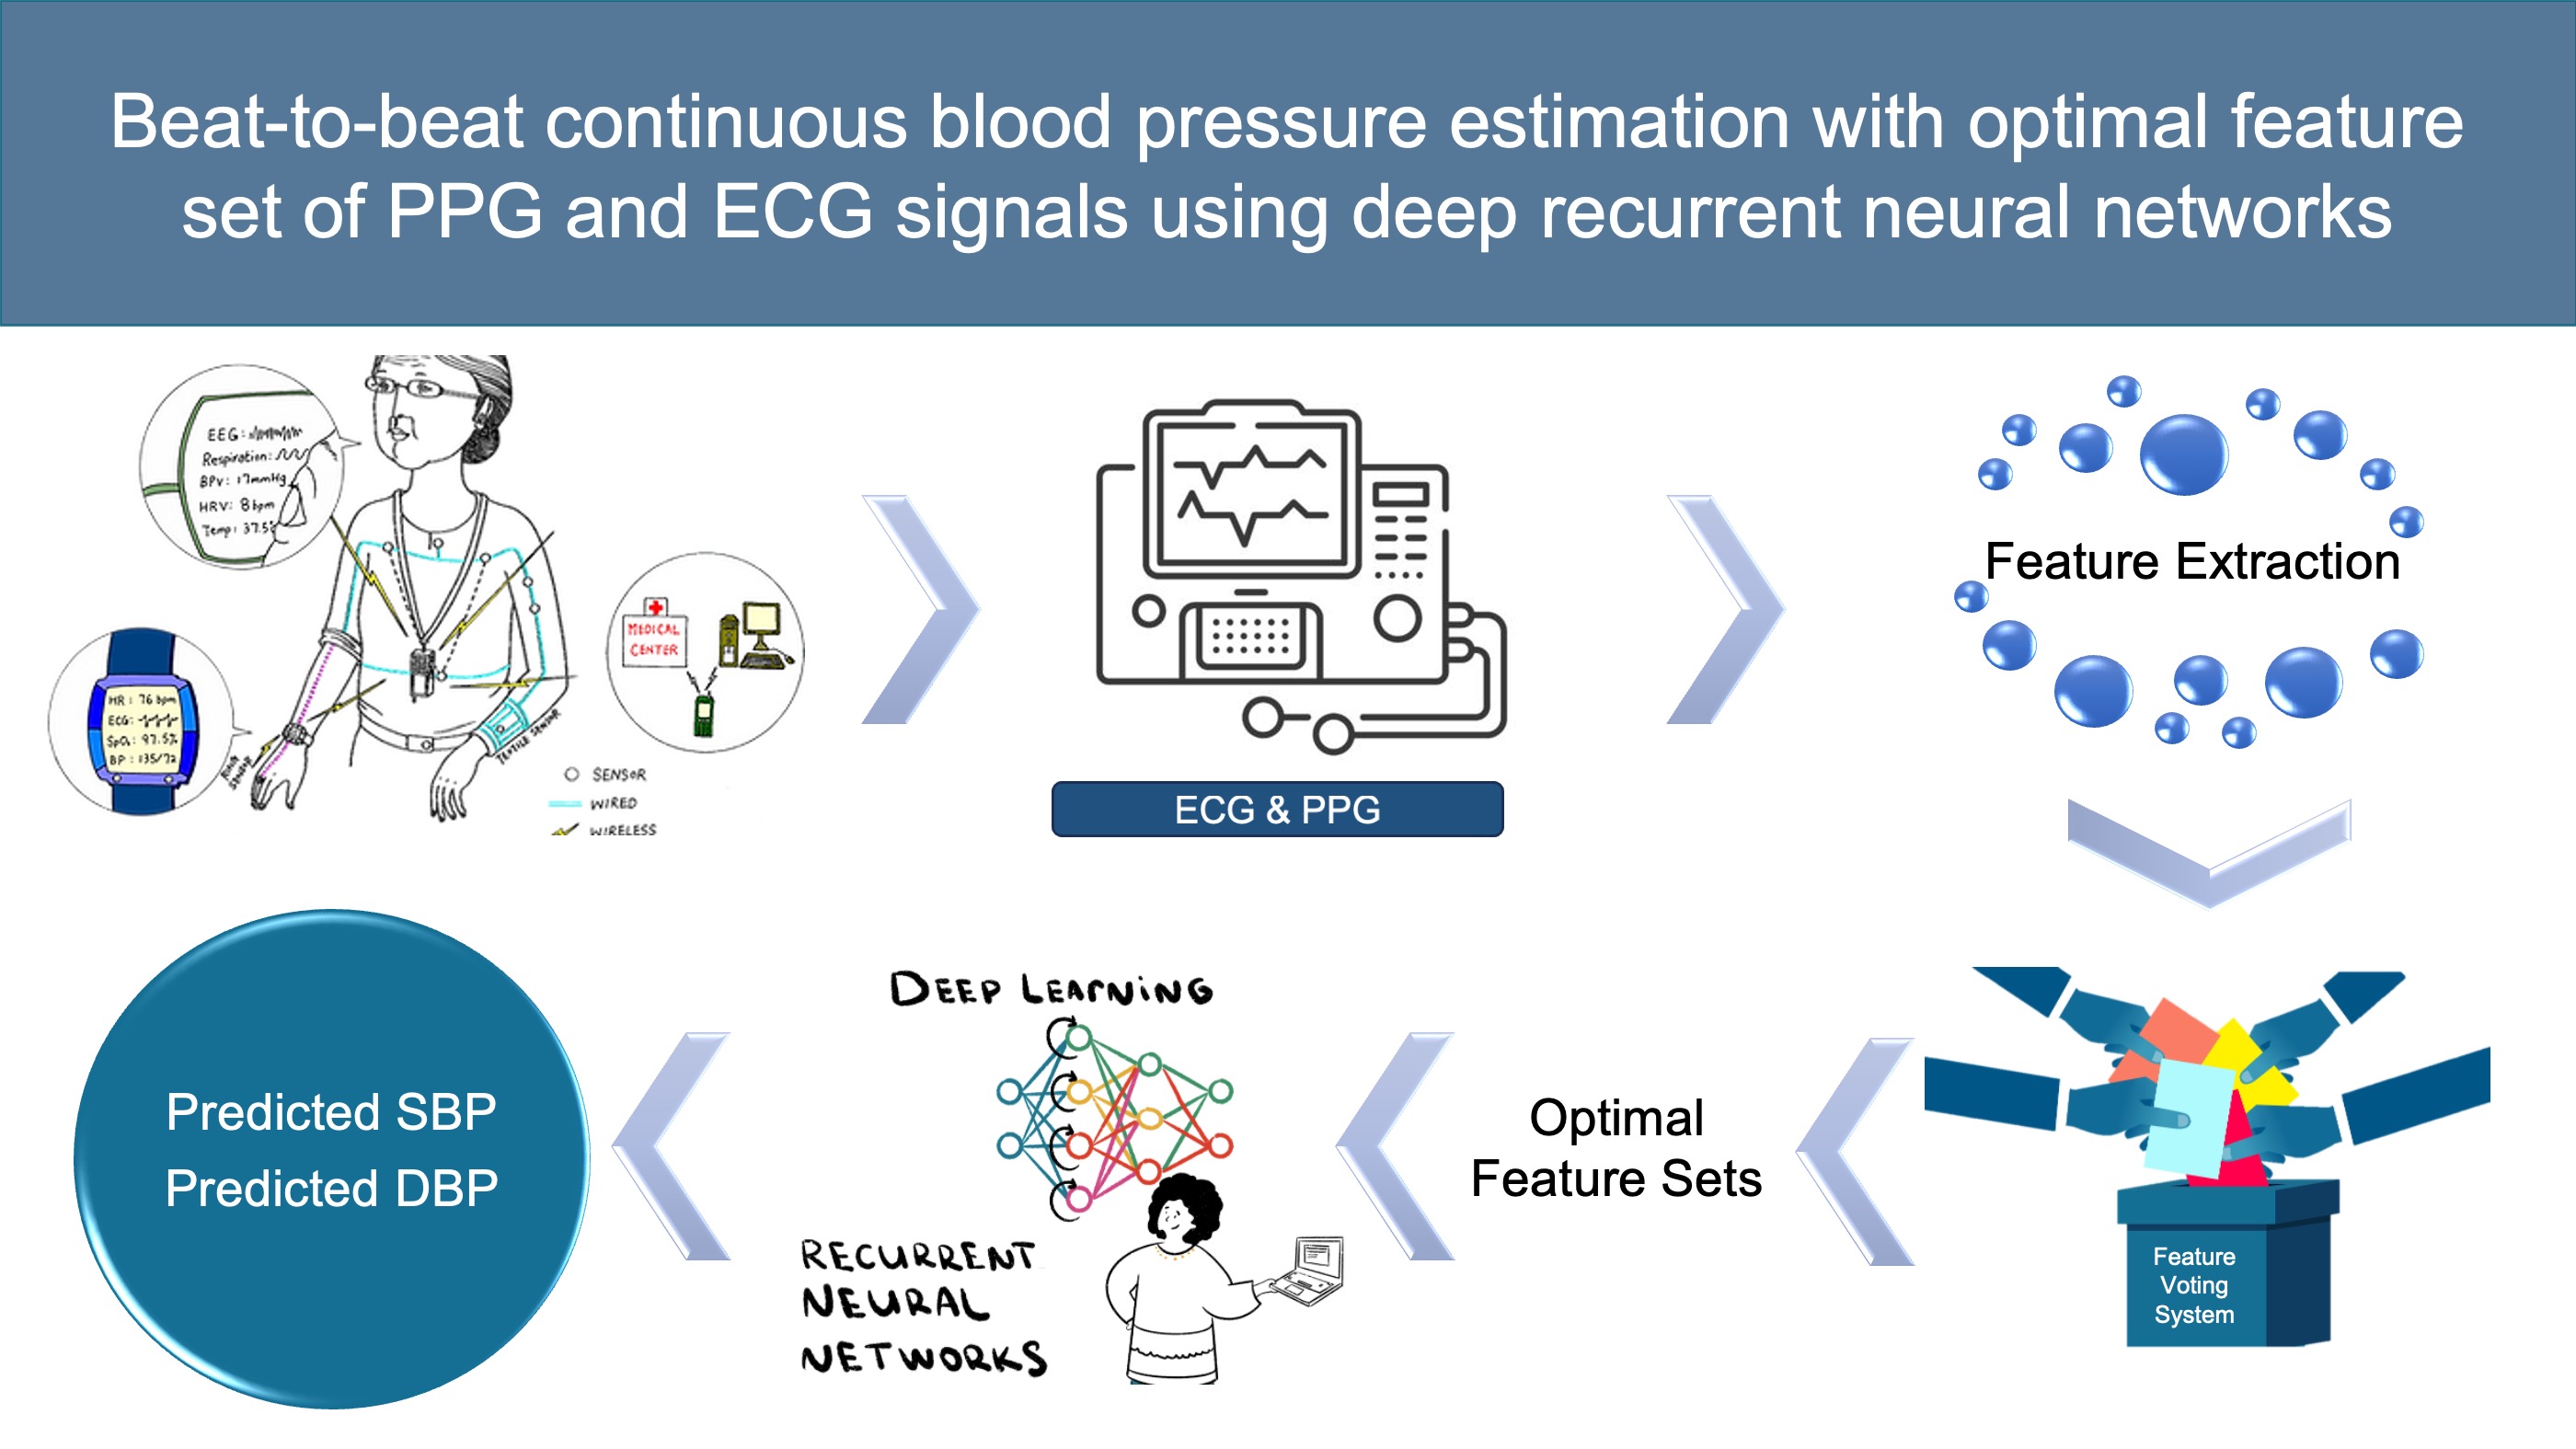
This section introduces the proposed three-stage process for high-performance blood pressure (BP) estimation using the RNN model with an optimal feature set of photoplethysmogram (PPG) and electrocardiogram (ECG) signals. The algorithm is designed to achieve accurate BP estimation and is outlined in Figure 1. The initial stage of our approach involves feature extraction, which encompasses preprocessing the PPG and ECG signals and extracting a total of 28 features. In the following step, we perform feature selection by applying five distinct feature selection methods. Our objective is to identify the optimal feature set that ensures accurate estimation of blood pressure (BP). Finally, the proposed deep RNN model is developed by randomly taking 594 subjects (90%) from the University of California Irvine (UCI) machine learning repository. The remaining 66 subjects (10%) are used for testing. We employed the 10-fold cross-validation method in our study, dividing the dataset of 660 subjects into 10 subsets, each containing 66 subjects. In each iteration of the cross-validation process, 1 subset is designated as the testing set, while the remaining 9 subsets are used as the training set. After training 10 times, 10 different models are obtained and evaluated on their corresponding testing sets. Finally, the performance of each model is averaged as the final performance.

Figure 1. Flowchart of the proposed continuous BP estimation algorithm.
Data and feature extraction
For evaluating the proposed algorithm, we utilized raw data sourced from the MIMIC II dataset[12]. This dataset comprises a comprehensive collection of photoplethysmogram (PPG) and electrocardiogram (ECG) signals, along with corresponding blood pressure (BP) measurements, obtained from thousands of patients in intensive care units (ICUs). The inclusion of such diverse and extensive data from real-world ICU settings enhances the robustness and generalizability of our algorithm's evaluation. This dataset contains PPG and ECG signals with corresponding BP from thousands of patients in intensive care units (ICU). However, ECG and PPG signals are instable, which can be affected by physiological activities, electromagnetic environment, and other factors. Signal preprocessing is necessary in order to extract features from ECG and PPG accurately. In this case, Kachuee et al. have made available preprocessed and clean data derived from the MIMIC II dataset[13]. Noises from all signals were removed using an averaging filter[13]. The dataset, consisting of 943 subjects and containing a total of 12,000 records, is available for access in the UCI machine learning repository. All PPG, ECG, and BP signals are sampled at 125 Hz and only the records longer than 8 minutes are chosen to develop our proposed RNN model. In our work, we used 660 subjects and each subject has one record. DBP and SBP were obtained from the minimum and maximum values in each heartbeat of each subject. Figure 2 illustrates the distribution of diastolic blood pressure (DBP) and systolic blood pressure (SBP). The dataset of 660 subjects was divided into four groups based on the office blood pressure threshold, as detailed in Table 1. Within our dataset, the standard deviation of SBP is 19.47 mmHg, while the standard deviation of DBP is 9.64 mmHg.

Figure 2. SBP and DBP ranges in the dataset.
Office blood pressure threshold
| Type (percentage) | SBP (mmHg) | DBP (mmHg) |
| Normal (36%) | 120 | < 80 |
| Prehypertension (35%) | 120-139 | 80-89 |
| Stage 1 hypertension (21%) | 140-159 | 90-99 |
| Stage 2 hypertension (8%) | ≥ 160 | ≥ 100 |
In order to confine the values of all samples within the range of (0, 1) for each record, it is essential to perform data normalization[14]. The equation indicated as (1) presents the expression used for normalizing the data. In this equation, the minimum and maximum values of the signals, denoted as xminand xmax respectively, are obtained from the signals x(t) within a specific window. The resulting normalized signals are represented by
In our work, six types of features with a total number of 28 were extracted from every ECG and PPG beat, as shown in Table 2. In order to extract these features, some fiducial points of each ECG and PPG beat are located, such as R-peaks of ECG beats, pulse foot, systolic peaks, dicrotic notches, and diastolic peaks of PPG beats. Figure 3 displays the schematic diagram illustrating the fiducial points and various features. The R-peaks of the ECG beats are extracted using the hierarchical clustering method[15] and all fiducial points in PPG beats are extracted based on the wavelet transform method[16]. In terms of phase space features of PPG signals, phase space reconstruction (PSR) and box-counting techniques are used[14]. Figure 4 provides an example illustrating how the phase-space diagram is divided into N × N pixels, where N represents an integer value.

Figure 3. Some features of ECG and PPG signals.

Figure 4. PSR features of a PPG beat.
Feature definitions
| Feature types | Features | Definitions |
| Time indices | PTTpp | Pulse transit time: from R-peak of ECG to systolic peak of PPG |
| PTTpf | Pulse transit time: from R-peak of ECG to pulse foot of PPG | |
| tSf | Time span from systolic peak to pulse foot | |
| tNf | Time span from dicrotic notch to pulse foot | |
| tDs | Time span from diastolic peak to systolic peak | |
| tFn | Time span from the next pulse foot to dicrotic notch | |
| tFf | Time span from the next pulse foot to pulse foot | |
| Slope indices | SNf | Slope from dicrotic notch to pulse foot |
| SSf | Slope from systolic peak to pulse foot | |
| SSd | Slope from systolic peak to diastolic peak | |
| Area indices | ASf | PPG area from systolic peak to pulse foot |
| ANs | PPG area from dicrotic notch to systolic peak | |
| ADn | PPG area from diastolic peak to dicrotic notch | |
| AFs | PPG area from the next pulse foot to systolic peak | |
| Intensity indices | RISd | PPG ratio from systolic peak to diastolic peak |
| RISf | PPG ratio from systolic peak to pulse foot | |
| RISn | PPG ratio from systolic peak to dicrotic notch | |
| RIDn | PPG ratio from diastolic peak to dicrotic notch | |
| Phase space indices | Ball | All number of black boxes from phase space diagram of PPG |
| B1/Ball | Degree of complexity in area 1 of phase space diagram | |
| B2/Ball | Degree of complexity in area 2 of phase space diagram | |
| B3/Ball | Degree of complexity in area 3 of phase space diagram | |
| B4/Ball | Degree of complexity in area 4 of phase space diagram | |
| B5/Ball | Degree of complexity in area 5 of phase space diagram | |
| B6/Ball | Degree of complexity in area 6 of phase space diagram | |
| B7/Ball | Degree of complexity in area 7 of phase space diagram | |
| B8/Ball | Degree of complexity in area 8 of phase space diagram | |
| Other | HR | Heart rate (R-R interval of ECG) |
As an illustration, the phase-space diagram of a single PPG beat is plotted using a time delay of
Feature selection
The efficiency of the model will be affected when a large number of features are used, because some features might be related to others, leading to redundant computational costs. Therefore, feature selection is used to construct the model by selecting the most relevant features among all features. It can reduce the dimensionality of input data of the model[17]. The objective in this case is to minimize the computational cost of the model while enhancing its performance through the incorporation of the most relevant features. In our work, five feature selection methods will be used, which are named ReliefF feature selection (ReliefF), correlation-based feature selection (CFS), mutual information method (MI), neighborhood component analysis (NCA), and relativity analysis (RA).
ReliefF feature selection
The original Relief is a feature selection algorithm based on binary classification problems[18]. For multi-class problems, the improved method ReliefF will be used, which combines Relief and K-nearest Neighbor[19]. ReliefF algorithm finds the k nearest hits (H) from the same class as X, as well as the k nearest misses (M) from each distinct class.
Correlation-based feature selection
Correlation is a statistical method utilized to assess the strength of the relationship between a set of features[20]. A feature is considered valuable if it contributes significantly to the class prediction without duplicating the information provided by other features[21]. Here, correlation coefficient probability (P-value) will be used to select a significant feature set from the hold set of features. The selected feature set will exhibit a high correlation with the class while demonstrating little to no correlation among the features themselves.
Mutual information method
Mutual information is a measure of how informative a random variable is about another variable. This method is very useful in feature selection because it can help quantify the correlation between a feature and the output value[22]. A high MI score shows a high dependency between the feature and the output value.
Neighborhood component analysis
Neighborhood component analysis (NCA) is a non-parametric and embedded feature selection method that belongs to supervised learning[23]. Its goal is to maximize the prediction accuracy of classification algorithms. The advantage of NCA is that it provides information on significant features while giving the ranking of the features[24].
Relativity analysis
To analyze the relationship between features, Pearson correlation analysis will be utilized[20]. Using the Pearson correlation coefficient
where E[(X - µx)(Y - µy)] is the covariance of X, Y and
Vote system
To address the limitations of feature selection algorithms, a voting system is implemented, as illustrated in Figure 5. First, for each specific algorithm, the importance of each feature was given, which is called the weight of features and features were sorted based on the weights at the same time. Then, for each algorithm, the top N features were assigned one vote and the final voting score sorted to select features. Here, N represents the number of features that are selected to build the model. Finally, features with high correlation will be removed based on the Pearson correlation coefficient.

Figure 5. Flowchart of the proposed vote system.
Deep recurrent neural network
The proposed deep recurrent neural network (RNN) model, as depicted in Figure 6, provides an overview of its architecture. It consists of a Bi-LSTM at the bottom layer, which is followed by a stack of five LSTM layers with residual connections. Furthermore, at the top two layers, there is a Bi-LSTM layer and a LSTM layer.

Figure 6. The proposed deep RNN architecture. Each circle represents a LSTM cell. Each red dashed box is a Bi-LSTM layer, which consists of forward (green) and backward (blue) LSTM. The blue dashed box represents the LSTM layer with residual connections.
In general, RNNs with deeper architecture tend to outperform shallow RNNs by a significant margin[25,26]. According to the experimental findings reported in[26], it was observed that the utilization of multiple layers of RNN led to a notable enhancement in expressive capacity. Nevertheless, employing a fully deep network can result in an escalation of computational complexity. Moreover, deep RNNs can be challenging to train due to issues such as gradient exploding and vanishing. To overcome these problems while preserving the benefits of recurrent connections, specific strategies are employed. An independently RNN (Ind-RNN) model was proposed[26]. This model effectively addresses the problems of gradient vanishing and exploding by regulating the gradient backpropagation through time.
An independently RNN (Ind-RNN) model was proposed[26]. It can regulate the gradient backpropagation through time to effectively address the gradient vanishing and exploding problems. The degradation problem was effectively addressed in[27] through the introduction of a deep residual learning framework. The experimental results indicated that their proposed deep residual nets achieved significant accuracy improvements as a result of the substantial increase in depth. Inspired by the deep residual learning framework in[27], we introduce a residual connection block designed to enhance the propagation of gradients within deep RNNs, specifically LSTM-based models. This approach facilitates more efficient gradient propagation in deep RNN architectures. An example of residual connections is given in Figure 7. The residual connections are implemented between ath LSTM layer and layer (a = 1, 2, 3, …, n). In this case,

Figure 7. An example of LSTM with residual connections.
Finally, the proposed deep RNN model can be developed by sequentially stacking multiple LSTM blocks of this type. Once the hidden state of the top layer (a = n) of LSTM is calculated, the final output yt at tth moment can be computed by equation (19):
In our work, the depth of the teacher model was set as 8. The experimental results demonstrated that when the depth of the deep RNN model exceeds 8, it can lead to the issue of overfitting. The reason for this phenomenon might be the limited training samples of VA classification. In addition, the sequence length of each training sample is initially set to 32, but it can be flexibly adjusted to higher as needed when employing a deeper RNN model. The hidden state size in the deep RNN model is 128 at each layer.
RESULT
Feature selection
The proposed feature voting system was introduced in Section “METHODOLOGY” in order to select the optimal feature sets for BP estimation. The Pearson correlation coefficient was calculated based on 28 features, setting ρx,y < -0.8 or ρx,y > 0.8 as strong correlation. Table 3 shows the features with high correlation among 28 features. Finally, 11 different feature sets with the number of features from 7 to 17 are determined in our work, which are shown in Table 4.
Strongly correlated features and corresponding Pearson correlation coefficients
| PTTpp | PTTpf | tFf | HR | ASf | ANs | B1/Ball | B2/Ball | B4/Ball | B5/Ball | B6/Ball | ||
| PTTpp | 0.99 | 1 | ||||||||||
| tFn | 0.94 | -0.87 | ||||||||||
| tFf | 1 | -0.94 | ||||||||||
| ANs | 0.89 | 1 | ||||||||||
| AFs | 0.86 | 0.94 | ||||||||||
| Ball | -0.92 | -0.88 | -0.87 | -0.86 | -0.87 | |||||||
| B1/Ball | 1 | 0.98 | 0.96 | 0.81 | 0.93 | |||||||
| B2/Ball | 1 | 0.94 | 0.91 | |||||||||
| B4/Ball | 1 | 0.87 | ||||||||||
Feature sets with different features
| Count | Selected features |
| 7 | PTTpp, SNf, ANs, RISf, HR, B3/Ball, B5/Ball |
| 8 | PTTpp, tDs, SNf, ANs, RISf, HR, B3/Ball, B5/Ball |
| 9 | PTTpp, tDs, SNf, SSf, SSd, RISf, HR, B3/Ball, B5/Ball |
| 10 | PTTpp, tDs, tFf, SNf, SSf, SSd, ADn, RISf, B3/Ball, B5/Ball |
| 11 | PTTpp, tFf, tDs, tFn, SNf, SSf, SSd, RISf, B3/Ball, B3/Ball, B5/Ball |
| 12 | PTTpf, tFf, tDs, tFn, SNf, SSf, SSd, ANs, RISf, B3/Ball, B3/Ball, B5/Ball |
| 13 | PTTpf, tSf, tDs, SNf, SSf, SSd, ANs, RISf, HR, B3/Ball, B4/Ball, B5/Ball, B7/Ball |
| 14 | PTTpf, tSf, tDs, SNf, SSf, SSd, ANs, RISf, HR, B3/Ball, B4/Ball, B5/Ball, B7/Ball, B8/Ball |
| 15 | PTTpp, tSf, tNf, tDs, SNf, SSf, SSd, ANs, RISf, HR, B3/Ball, B4/Ball, B5/Ball, B7/Ball, B8/Ball |
| 16 | PTTpp, tSf, tNf, tDs, SNf, SSf, SSd, ANs, ADn, RISf, HR, B3/Ball, B4/Ball, B5/Ball, B7/Ball, B8/Ball |
| 17 | PTTpp, tSf, tNf, tDs, SNf, SSf, SSd, ANs, ADn, RISf, RISn, HR, B3/Ball, B4/Ball, B5/Ball, B7/Ball, B8/Ball |
Model performance
This section presents the outcomes of our proposed deep RNN model tested on 660 subjects based on different feature sets using 10-fold validation. All features are derived from ECG and PPG signals and each feature set is determined using a vote system of five feature selection methods.
To facilitate comparisons between our proposed model and those found in the literature, we evaluate the performance of blood pressure (BP) estimation using the following equations, which measure estimation accuracy through root mean square error (RMSE) and mean absolute error (MAE).
where yi is the ground truth of BP and

Figure 8. Comparison of the ground truth and prediction of a representative subject.
Performance comparison of RNN model with different feature sets based on 10-fold validation
| RMSE | MAE | |||||
| Feature set | SBP | DBP | MAP | SBP | DBP | MAP |
| 7-features | 3.429* | 1.918* | 2.235* | 2.662 | 1.479 | 1.738* |
| 9-features | 3.336 | 1.834 | 2.159* | 2.607 | 1.434 | 1.692 |
| 11-features | 3.416* | 1.837 | 2.177* | 2.636* | 1.431 | 1.694 |
| 12-features | 3.336 | 1.794 | 2.118 | 2.579 | 1.371 | 1.639 |
| 13-features | 3.264 | 1.811 | 2.111 | 2.521 | 1.413 | 1.634 |
| 14-features | 3.223 | 1.781 | 2.062 | 2.514 | 1.383 | 1.618 |
| 16-features | 3.401* | 1.901* | 2.179* | 2.612 | 1.485* | 1.707* |
| All-features | 3.407* | 1.876* | 2.183* | 2.641* | 1.435 | 1.699 |
| 14-features without PSR | 3.478* | 1.951* | 2.271* | 2.701* | 1.492* | 1.763* |
The Bland-Altman graph (BA graph) is widely used in biomedical research to compare the agreement between two measurements[28]. It shows the agreement between the prediction BP and the reference BP by using the mean difference BP and the average BP[4]. In Figure 9, the Bland-Altman (BA) graph displays the average value of the reference BP and estimated BP on the x-axis, while the y-axis represents the difference between them. The bias (Mean) and the limits of agreement (Mean ± 1.96 × SD) of our work are shown as dashed line. The mean difference of DBP and SBP are -0.13 and -0.59, respectively. It is shown that for both DBP and SBP, the majority of data points fall within the limits of agreement, signifying a close agreement between the estimated BP and the reference BP. Additionally, Figure 10 illustrates correlation graphs for DBP and SBP. The x-axis represents the ground truth BP, while the y-axis represents the predicted BP. The red dashed line indicates when the ground truth and predicted BP are equal. The green line signifies the linear regression relationship between ground truth BP and predicted BP. On the test data, the correlation coefficients are 0.634 for DBP and 0.888 for SBP.

Figure 9. Bland-Altman plots of the DBP (left) and SBP (right) predictions by the proposed RNN model.

Figure 10. Correlation plot for DBP (left) and SBP (right) targets.
DISCUSSION
In this paper, we introduced a beat-to-beat blood pressure (BP) monitoring method that integrates feature selection techniques with deep recurrent neural networks. The method mainly includes signal preprocessing, feature extraction, and feature selection. The feature voting system is used to obtain the optimal feature sets with different numbers of features based on the main votes of five feature selection algorithms. In addition, the RNN model based on Bi-LSTM and LSTM was developed to estimate BP. In this case, the proposed model was validated using 66 subjects, which is 10% of the total dataset. The combination of feature voting system and the deep RNN model achieved good results on both MAE and RMSE between BP ground truth and BP prediction. Table 6 offers a comparison of our proposed method with contemporary approaches based on the same dataset from UCI. Our proposed method gave an average RMSE of 1.781, 2.062 and 3.223 for DBP, MAP and SBP, and gave an average MAE of 1.383, 1.618 and 2.514 for DBP, MAP and SBP, respectively. Overall, our model's performance is on par with or superior to other methods.
Performance comparison with related works for BP estimation
| Authors | Method | RMSE | MAE | ||||
| SBP | DBP | MAP | SBP | DBP | MAP | ||
| Qiu, et al. (2021)[29] | Composite neural network with SE block | - | - | - | 3.70 | 2.81 | - |
| El-hajj and Kyriacou P (2021)[30] | Bi-GRU+GRU+attention | - | - | - | 2.58 | 1.26 | - |
| Ganti, et al. (2021)[31] | PTT based | 4.75 | 2.72 | 2.99 | 4.03 | 2.24 | 2.50 |
| Zhang, et al. (2023)[19] | MPGA-BPN | 8.23 | 8.92 | - | 6.51 | 6.11 | - |
| Liu, et al. (2021)[1] | GPR | - | - | - | 4.8 | 3.4 | - |
| Esmaelpoor, et al. (2020)[11] | CNN+LSTM | - | - | - | 3.97 | 2.10 | - |
| Our current work | Proposed model | 3.223 | 1.781 | 2.062 | 2.514 | 1.383 | 1.618 |
Table 7 presents an evaluation of the proposed method by BHS standard. BHS grades the BP estimation into Grades A, B, and C based on the percentage of cumulative errors MAE less than the three threshold values, i.e., 5, 10, and 15 mmHg, respectively[32]. Our proposed method achieved Grade A for DBP, MAP, and SBP estimation according to the BHS standard.
Comparison with the BHS standard
| Cumulative error percentage | ||||
| ≤ 5 mmHg | ≤ 10 mmHg | ≤ 15 mmHg | ||
Our results | SBP | 89.3% | 100% | 100% |
| MAP | 95.5% | 100% | 100% | |
| DBP | 96.9% | 100% | 100% | |
BHS[32] | Grade A | 60% | 85% | 95% |
| Grade B | 50% | 75% | 90% | |
| Grade C | 40% | 65% | 85% | |
In conclusion, we introduced a deep RNN model with an optimal feature set of ECG and PPG signals to achieve continuous and noninvasive BP estimation. Primarily, the proposed method comprises signal preprocessing, feature extraction, feature selection, and RNN model stages. The results indicate that the performance of this method is comparable or higher than other related works. In addition, our proposed blood pressure estimation method was validated on the BHS standard. The estimation of DBP, MAP, and SBP achieved BHS standard Grade. However, the results may not provide a comprehensive view of our method's overall performance since the testing was conducted on a limited dataset of 66 subjects. Our future work will involve testing our method on larger and more diverse datasets. Moreover, some deep learning models have the ability to select features automatically; the comparison between our feature voting system and such deep learning models should be further analyzed. Finally, it is possible to integrate our proposed method to develop a healthcare monitoring system to improve patients’ life quality.
DECLARATIONS
Authors’ contributions
Conceptualization, data collection, methodology, software, validation, writing - original draft: Chen H
Conceptualization, methodology, software, validation, writing - original draft: Lyu L
Methodology, software: Zeng Z
Review, statical analysis: Jin Y
Conceptualization, supervision, project administration: Zhang Y
Availability of data and materials
All patient records and data were extracted from the University of California Irvine (UCI) machine learning repository.
Financial support and sponsorship
This work was supported fully by InnoHK Project at Hong Kong Centre for Cerebro-Cardiovascular Health Engineering (COCHE).
Conflicts of interest
All authors declared that there are no conflicts of interest.
Ethical approval and consent to participate
Not applicable.
Consent for publication
Not applicable.
Copyright
© The Author(s) 2023.
REFERENCES
1. Liu Q, Zheng Y, Zhang Y, Poon CCY. Beats-to-beats estimation of blood pressure during supine cycling exercise using a probabilistic nonparametric method. IEEE Access 2021;9:115655-63.
2. World health statistics 2015. Geneva: World Health Organization; 2015. Avaliable from: https://www.who.int/publications/i/item/9789240694439 [Last accessed on 16 Oct 2023].
3. Chow CK, Teo KK, Rangarajan S, et al. PURE (Prospective Urban Rural Epidemiology) Study investigators. Prevalence, awareness, treatment, and control of hypertension in rural and urban communities in high-, middle-, and low-income countries. JAMA 2013;310:959-68.
4. Thambiraj G, Gandhi U, Mangalanathan U, Jose VJM, Anand M. Investigation on the effect of Womersley number, ECG and PPG features for cuff less blood pressure estimation using machine learning. Biomed Signal Process Control 2020;60:101942.
5. Simjanoska M, Gjoreski M, Bogdanova AM, Koteska B, Gams M, Tasic JF. ECG-derived blood pressure classification using complexity analysis-based machine learning. Proceedings of the 11th International Joint Conference on Biomedical Engineering Systems and Technologies, 2018 Jan 19-21; Funchal, Portugal.
6. Zhou ZB, Cui TR, Li D, et al. Wearable continuous blood pressure monitoring devices based on pulse wave transit time and pulse arrival time: a review. Materials 2023;16:2133.
7. Ding XR, Zhao N, Yang GZ, et al. Continuous blood pressure measurement from invasive to unobtrusive: celebration of 200th birth anniversary of Carl Ludwig. IEEE J Biomed Health Inform 2016;20:1455-65.
8. Poon CC, Zhang YT. Cuff-less and noninvasive measurements of arterial blood pressure by pulse transit time. Conf Proc IEEE Eng Med Biol Soc 2005;2005:5877-80.
9. Ding XR, Zhang YT, Liu J, Dai WX, Tsang HK. Continuous cuffless blood pressure estimation using pulse transit time and photoplethysmogram intensity ratio. IEEE Trans Biomed Eng 2016;63:964-72.
10. Yan WR, Peng RC, Zhang YT, Ho D. Cuffless continuous blood pressure estimation from pulse morphology of photoplethysmograms. IEEE Access 2019;7:141970-7.
11. Esmaelpoor J, Moradi MH, Kadkhodamohammadi A. A multistage deep neural network model for blood pressure estimation using photoplethysmogram signals. Comput Biol Med 2020;120:103719.
12. Saeed M, Villarroel M, Reisner AT, et al. Multiparameter intelligent monitoring in intensive care II: a public-access intensive care unit database. Crit Care Med 2011;39:952-60.
13. Kachuee M, Kiani MM, Mohammadzade H, Shabany M. Cuff-less high-accuracy calibration-free blood pressure estimation using pulse transit time. Proceedings of IEEE international symposium on circuits and systems (ISCAS); 2015 May 24-27; Lisbon, Portugal.
14. Chen H, Das S, Morgan J, Maharatna K. An effective PSR-based arrhythmia classifier using self-similarity analysis. Biomed Signal Process Control 2021;69:102851.
15. Chen H, Maharatna K. An automatic R-peak detection method based on hierarchical clustering. Proceedings of IEEE Biomedical Circuits and Systems Conference (BioCAS); 2019 Oct 17-19; Nara, Japan.
16. Teng XF, Zhang YT. Continuous and noninvasive estimation of arterial blood pressure using a photoplethysmographic approach. Proceedings of the 25th Annual International Conference of the IEEE Engineering in Medicine and Biology Society (IEEE Cat. No. 03CH37439); 2003 Sep 17-21; Cancun, Mexico.
17. Khaire UM, Dhanalakshmi R. Stability of feature selection algorithm: a review. Comput Inf Sci 2022;34:1060-73.
18. Robnik-šikonja M, Kononenko I. Theoretical and empirical analysis of ReliefF and RReliefF. Mach Learn 2003;53:23-69.
19. Zhang L, Ji Z, Yang F, Chen G. Noninvasive continuous blood pressure estimation with fewer parameters based on RA-ReliefF feature selection and MPGA-BPN models. Biomed Signal Process Control 2023;84:104757.
20. Raju STU, Dipto SA, Hossain MI, et al. A novel technique for continuous blood pressure estimation from optimal feature set of ppg signal using deep learning approach. Res Sq Forthcoming 2023.
21. Kavsaoğlu AR, Polat K, Hariharan M. Non-invasive prediction of hemoglobin level using machine learning techniques with the PPG signal's characteristics features. Appl Soft Comput 2015;37:983-91.
22. Vergara JR, Estévez PA. A review of feature selection methods based on mutual information. Neural Comput Appl 2014;24:175-86.
23. Goldberger J, Hinton GE, Roweis S, Salakhutdinov RR. Neighbourhood components analysis. In: Saul LK, Weiss Y, Bottou L, editors. Advances in neural information processing systems 17. Cambridge: The MIT Press; 2005.
24. Raghu S, Sriraam N. Classification of focal and non-focal EEG signals using neighborhood component analysis and machine learning algorithms. Expert Syst Appl 2018;113:18-32.
25. Amodei D, Ananthanarayanan S, Anubhai R, et al. Deep speech 2: end-to-end speech recognition in English and Mandarin. Proceedings of The 33rd International Conference on Machine Learning; 2016 Jun 19-24; New York, USA.
26. Li S, Li W, Cook C, Zhu C, Gao Y. Independently recurrent neural network (indrnn): Building a longer and deeper rnn. Proceedings of the IEEE conference on computer vision and pattern recognition; 2018 Jun 18-22; Salt Lake City, USA.
27. He K, Zhang X, Ren S, Sun J. Deep residual learning for image recognition. Proceedings of the IEEE conference on computer vision and pattern recognition; 2016 Jun 27-30; Las Vegas, USA.
28. Karun KM, Puranik A. BA.plot: an R function for bland-altman analysis. Clin Epidemiol Glob Health 2021;12:100831.
29. Qiu Y, Liu D, Yang G, et al. Cuffless blood pressure estimation based on composite neural network and graphics information. Biomed Signal Process Control 2021;70:103001.
30. El-hajj C, Kyriacou P. Deep learning models for cuffless blood pressure monitoring from PPG signals using attention mechanism. Biomed Signal Process Control 2021;65:102301.
31. Ganti VG, Carek AM, Nevius BN, Heller JA, Etemadi M, Inan OT. Wearable cuff-less blood pressure estimation at home via pulse transit time. IEEE J Biomed Health Inform 2021;25:1926-37.
Cite This Article
Export citation file: BibTeX | RIS
OAE Style
Chen H, Lyu L, Zeng Z, Jin Y, Zhang Y. Beat-to-beat continuous blood pressure estimation with optimal feature set of PPG and ECG signals using deep recurrent neural networks. Vessel Plus 2023;7:21. http://dx.doi.org/10.20517/2574-1209.2023.30
AMA Style
Chen H, Lyu L, Zeng Z, Jin Y, Zhang Y. Beat-to-beat continuous blood pressure estimation with optimal feature set of PPG and ECG signals using deep recurrent neural networks. Vessel Plus. 2023; 7: 21. http://dx.doi.org/10.20517/2574-1209.2023.30
Chicago/Turabian Style
Chen, Hanjie, Liangyi Lyu, Zezhen Zeng, Yanwei Jin, Yuanting Zhang. 2023. "Beat-to-beat continuous blood pressure estimation with optimal feature set of PPG and ECG signals using deep recurrent neural networks" Vessel Plus. 7: 21. http://dx.doi.org/10.20517/2574-1209.2023.30
ACS Style
Chen, H.; Lyu L.; Zeng Z.; Jin Y.; Zhang Y. Beat-to-beat continuous blood pressure estimation with optimal feature set of PPG and ECG signals using deep recurrent neural networks. Vessel Plus. 2023, 7, 21. http://dx.doi.org/10.20517/2574-1209.2023.30
About This Article
Special Issue
Copyright

Data & Comments
Data
0

 Cite This Article 19 clicks

 Like This Article 8
likes
Like This Article 8
likes


Comments
Comments must be written in English. Spam, offensive content, impersonation, and private information will not be permitted. If any comment is reported and identified as inappropriate content by OAE staff, the comment will be removed without notice. If you have any queries or need any help, please contact us at support@oaepublish.com.