
Serum and tissue light-chains as disease biomarkers and targets for treatment in AL amyloidosis
 0
0Abstract
Amyloid light-chain (AL) amyloidosis is the most common type of systemic amyloidosis and is a multi-organ disease affecting mostly the heart and kidneys. AL amyloidosis is a protein misfolding disorder characterized by the tissue deposition of monoclonal light chains (LCs) produced by neoplastic plasma cells. Measurement of circulating free LC (FLC) is an important tool for diagnosis, risk stratification, and management of AL amyloidosis and can be performed through antibody-based methods or mass spectrometry. Furthermore, correct identification of LC deposits in tissues is essential to diagnose AL amyloidosis. Together with antibody-based techniques, methods relying on mass spectroscopy are now available.
Keywords
INTRODUCTION
Amyloidosis is a disease caused by tissue deposition of insoluble protein fibrils composed of misfolded proteins. The word “amyloid” was first used in human pathophysiology by Rudolf Virchow in 1854 to describe a pathologic substance initially thought to be related to starch or cellulose but later demonstrated to be composed of proteins[1]. Its fibrils are made of protein precursors, proteins that self-assemble in a β-sheet conformation. Based on different amyloidogenic precursors, the deposits found in tissues may cause different forms of amyloidosis. Amyloid light-chain (AL) amyloidosis is the most common form, which is characterized by tissue accumulation of free (i.e., not bound) light chains (FLCs) of antibodies produced by a plasma cell disorder. Clonal light chains (LCs) are either lambda (70%-80% of patients) or kappa (20%-30%).
Amyloidosis has always been considered a rare disease, but it is increasingly recognized as an underdiagnosed condition. About 4000 people are diagnosed with AL amyloidosis each year in the United States, with most diagnoses between the ages of 50 and 65[2]. Prevalence rose from 8.8-15.5 cases per million before 2010 to 40-58 cases per million after 2010[3]. In AL amyloidosis, FLCs are usually present in the bloodstream in excess quantity, with no apparent function. This higher production increases the risk of fibrils formation and consequently organ damage. However, it can happen that “normal” amounts of light chains can also deposit in organs and damage them. These represent a danger to the health of single cells (direct toxicity when internalized) and organs and tissues as well, as they tend to deposit in them forming fibrils. This compromises their integrity and function, leading to diseases caused by the malfunctioning of the specific organ [Figure 1]. Measurement of circulating free LC (FLC) is an important tool for diagnosis, risk stratification, and management of AL amyloidosis and can be performed through antibody-based methods or mass spectrometry. Furthermore, correct identification of LC deposits in tissues is essential to diagnose AL amyloidosis. Together with antibody-based techniques, methods relying on mass spectroscopy are now available. This review summarizes the applications of LC measurements in the blood and tissues for the diagnosis and management of patients with AL amyloidosis.
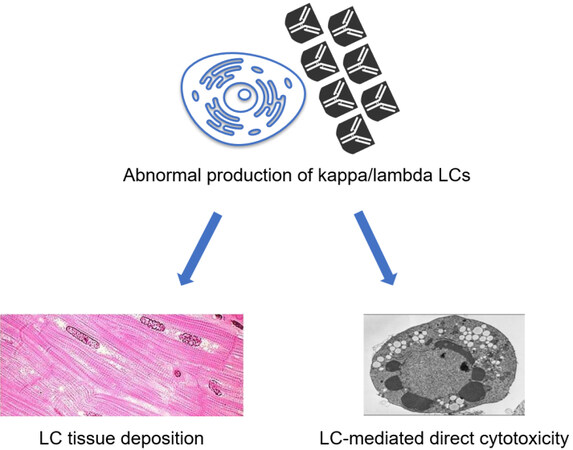
Figure 1. Mechanisms of AL amyloidosis and tissue damage. Damage is caused by tissue accumulation, particularly in the heart and kidneys. Misfolded light chains (LCs) damage the cells by inducing apoptosis, mitochondrial, and lysosomal dysfunction.
LIGHT CHAINS AS DETERMINANTS OF TISSUE DAMAGE
The first mechanism of damage is likely to direct cell toxicity by amyloid precursors[4]. This includes direct damage to cardiomyocytes, which may account for the rapid clinical progression of AL-CA compared to ATTR-CA[5]. The second damage mechanism is represented by the mass effect of amyloid deposition that disrupts the tissue architecture and compromises organ function. For this reason, AL amyloidosis has been described as a “toxic infiltrative cardiomyopathy”. Soluble LCs are themselves harmful to cells that internalize them[6,7]. Several changes have been documented in animal models of light-chain cardiotoxicity, including apoptosis, oxidative stress, mitochondrial dysfunction, impaired calcium handling and contractility, abnormal autophagy, and lysosomal dysfunction[8,9]. The same detrimental effects were searched in the two most prevalent cell types in the human heart: cardiomyocytes[10] and fibroblasts[11]. It was found that amyloidogenic LCs interact with cell components and proteins, likely by seizing them or interfering with their function. In mitochondria, amyloidogenic LCs would specifically interact with OPA1 (optic atrophy 1-like protein), placed in the inner mitochondrial membrane, and with peroxisomal ACOX1 (i.e., the first enzyme of the fatty acid beta-oxidation pathway)[12], thus altering crucial metabolic pathways. Furthermore, the extracellular matrix likely plays a major role in the pathogenesis and organ selectivity of amyloidosis. Indeed, exposing cells to amyloidogenic proteins induces changes in the secretion and processing of matrix proteins, and fibril deposition occurs in close spatial relation with collagen and glycosaminoglycans.
LIGHT CHAINS AS DIAGNOSTIC TOOLS
To guarantee the full use of all the produced heavy chains, LCs are produced with a physiological excess quantity of 500 mg/day. In the bloodstream, they can exist as both monomers and dimers. While kappa FLCs have a greater tendency to form monomers, lambda FLCs exist mainly as dimers. Monoclonal serum immunoglobulins might manifest as an aberrant peak on serum protein electrophoresis (ELP), which can be further characterized by serum immunofixation (S-IF). Conversely, the ELP pattern is usually unchanged when only an excessive amount of monoclonal FLCs is synthesized. Compared to other plasma cell disorders, in AL amyloidosis, a relatively low concentration of circulating monoclonal proteins is found, and only FLCs are detected in half of the cases.
Automated serum FLC assays have improved the quantification of serum FLC, the kappa/lambda ratio, and the ratio between involved and uninvolved FLC (i/uFLC), thus revolutionizing the diagnosis and monitoring of plasma cell disorders. In subjects with normal kidney function, the κ/λ ratio ranges between 0.26 and 1.65 when using the Freelite® assay. In patients with chronic kidney disease, the reticuloendothelial system becomes more important for FLC removal, and the ratio can increase up to 3 with the same assay (range 0.37-3.10). In patients with cardiac disease, a normal κ/λ FLC ratio has a 100% negative predictive value for AL-CA[13].
Assays for FLC quantification
Five diagnostic assays to measure serum FLC are commercially available: Freelite®, N Latex FLC, Diazyme, Seralite®, and Sebia FLC assays. Each method is based on antibodies able to identify specific epitopes of the FLC. These are described as “hidden” because they seem to be visible only when the LCs are actually free, while they cannot be recognized when they are paired with heavy chains. Table 1 summarizes the main characteristics of these assays.
Assays for free light-chain detection and quantification
| Assay | Antisera | Method | Platform | Strengths |
| Freelite® FLC | Polyclonal | - Nephelometric -Turbidimetric | - BN II System - Optilite | - Reference method for IMWG - First developed method - Long-standing on the market |
| N Latex FLC | Monoclonal | Nephelometric | BN II System | High sensitivity |
| Diazyme human κ/λ FLC | Polyclonal | Turbidimetric | Advia 1800 | High sensitivity |
| Seralite® FLC | Monoclonal | Lateral flow immunoassay | ADxRL5 | - Reduced false negatives - Coupled measurement of κ-λ |
| Sebia FLC ELISA κ/λ | Polyclonal | ELISA sandwich | AP22 Elite | - Larger measurement interval - Reduced repetitions needed for FLC quantification |
Freelite® assay
The Freelite® assay (The Binding Site Group Ltd, Birmingham, UK) was the first method commercialized to measure serum FLCs on automated platforms, and represented the only method available for 10 years. It is the referral tool in the International Myeloma Working Group (IMWG) guidelines[14,15]. The polyclonal FLC antibodies targeting kappa and lambda chains are derived from sheep immunized with FLC purified from urine samples from human patients with a monoclonal protein into the urine (Bence–Jones proteinuria). The created antibodies undergo a purifying process through affinity: they are paired with intact immunoglobulins and only reactive ones are kept. Antibodies are plastered with polystyrene latex particles and evaluated through nephelometric or turbidimetric methods. Calibration materials consist of human serum containing known amounts of FLCs. The producer suggests reference values from the BN II System (Siemens Healthineers Diagnostics GmbH, Marburg, Germania, nephelometric technique)[15].
Some issues with this assay have emerged. FLCs in the same sample can be quantified differently on different platforms, even with the same reagent. It is then important to specify the specific platform and technique used[16]. In addition, nephelometric and turbidimetric reactions can present either lack of linearity or problems due to the excess antigen effect. Indeed, a very wide range of FLC concentrations is found in plasma cell diseases, which increases the risk for underestimation due to the excess antigen or sample dilution effects[17].
N latex FLC assay
The N Latex FLC assays (Siemens Healthineers Diagnostics GmbH, Marburg, Germany) are latex-based assays designed specifically for the Siemens BN II nephelometric systems. Murine monoclonal antibodies able to recognize specific epitopes in the constant domains of FLCs are selected. Nonspecific interactions are minimized by detergents. The calibrator solution for kappa and lambda FLC tests is represented by purified polyclonal in phosphate-buffered saline with 1% human serum albumin. The calibration process of this specific assay is performed following the Freelite® standard, to have two comparable tests. In AL amyloidosis, this assumption can be made, as the quantification levels are extremely similar[7]. On the contrary, discrepant results have been observed occasionally in multiple myeloma. Indeed, after several comparison studies, it has been concluded that the two assays have similar clinical value, but they cannot be used interchangeably for patient monitoring[18].
FLC x or x Diazyme assay
The FLC Diazyme Human κ or λ assays (Diazyme Laboratories Inc., Poway CA, USA) are high-sensitivity immunoturbidimetric tests based on rabbit polyclonal antisera adsorbed to microparticles forming a colloidal suspension (latex). Two studies compared this assay to the Freelite® assay, finding a sufficient concordance for kappa chains, while for lambda ones a high level of discrepancy was found[19,20].
FLC Seralite® assay
The Seralite® assay (Abingdon Health-Sebia, Evry, France) allows simultaneously measuring κ and λ FLCs, taking advantage of competitive inhibition. It consists of two anti-kappa and two anti-lambda monoclonal antibodies. It is based on the competition to bind with the antibodies coupled with gold nanoparticles between the FLCs in the blood sample and the purified and immobilized FLCs in the device. The signal produced by the tagged monoclonal antibodies (detected by the ADxLR5 reader, Abingdon Health-Sebia) is inversely proportional to the FLC concentration in the sample[21]. This method was designed to address the issue of false negatives due to the excess antigen effect. No significant differences are found in median FLC values compared to the Freelite® test, although the κ/λ ratio of Seralite® has a wider range[21].
Sebia FLC ELISA assay
The Sebia assay (Sebia, Evry, France) is based on an enzyme-linked immunosorbent assay (ELISA) sandwich method. This approach relies on rabbit polyclonal antibodies targeting FLCs. To allow measurement of the antigen-antibody bond, the secondary antibody is labeled with horseradish peroxidase[22]. This assay has also been completely automatized by validation on the AP22 ELITE ELISA processor. The Sebia assay has a good correlation to the Freelite® one and, having a wider measurement interval, even reduces the number of repetitions necessary for accurate quantification. However, there is an increasing tendency toward discrepancy between the two assays in parallel with serum FLC concentration[23].
FLC measurement in patients with AL amyloidosis
FLC test, together with serum protein electrophoresis and immunofixation of the serum and urine, is used to accurately diagnose AL amyloidosis[24]. FLC measurement is also an extremely important parameter for the follow-up of patients already diagnosed with the disease. The difference between the concentration of involved FLCs, due to clonal expansion, and non-involved FLCs (dFLC) has received increasing attention in the field of amyloidosis. dFLC (measured through the Freelite® assay) is one of the strongest predictors of overall survival in AL amyloidosis, with the 180 mg/L cut-off being included in the prognostic MAYO2012 score[25]. Furthermore, a > 50% decrease in dFLC or a reduction to < 40 mg/L is an important criterion of response to treatment[26].
A subsequent study of comparison reported a lower prognostic cut-off for dFLC (165 mg/L) when FLCs were measured with N Latex FLC[7]. However, because the studies that incorporate dFLC in the staging system and in response criteria refer to the Freelite® test, the N Latex assays, despite having equivalent diagnostic sensitivity and prognostic value, cannot be utilized for staging, nor for identifying the response to therapy.
Differences between these two methods have also been correlated with the oligomeric form of FLCs[27,28]. Indeed, the Freelite® assay has been recently demonstrated to recognize better lambda FLC dimers bound by an inter-chain disulfide bridge, whereas the N Latex reagent highly recognizes the lambda FLC monomers[29]. Therefore, the different epitopes recognized might introduce a further bias, preventing the interchangeable use of the two assays in clinical practice.
Mass spectrometry to detect and quantify amyloid light chains in serum
It is known that the serum FLC quantitation adds sensitivity to the screening panel used to early intercept AL amyloidosis, thus IMWG has recommended its use since its early introduction in 2009 despite the limits[30,31]. Despite the improvement achieved for the available tests, immunochemical testing of FLC suffers unavoidable problems such as the hook effect. Thus, different methods able to provide more reliable results are needed. In the last years, mass spectrometry (MS) has been proposed for several reasons: laboratory equipment is becoming simpler and affordable and the technique takes advantage of the unique aminoacidic sequence in the CDR region of the expanded monoclonal light chain to identify and quantify it. There are two approaches of MS that can be employed. The first one needs the previous identification of the specific amino acid sequence of the CDR region of the monoclonal protein to identify the peptide to be monitored as the target by LC-MS/MS. This technique is called clonotypic peptide, and it was originally developed on heavy chains of entire monoclonal proteins[32] and then set up for light chains[33]. This is a sensitive technique that was demonstrated to be of value especially for MRD monitoring, but the identification of the specific target sequence needs time and may be difficult to obtain. The second method, called miRAMM (monoclonal immunoglobulin rapid accurate mass measurement), was developed to be applied to samples without knowledge of any amino acid sequence[34]. The original method was set on samples where Ig were enriched, then reduced to free the light chains, and finally submitted to LC-ESI-TOF MS. The mass spectra of multiply charged light chains were deconvoluted to obtain their molecular mass and the monoclonal light chain emerged as a single peak. Kappa and lambda light chains were distinguished by the different m/z distribution of their constant regions. The same group that developed this original method adapted the miRAMM technique to a MALDI-TOF MS [matrix-assisted laser desorption ionization (MALDI) time of flight (TOF)] without the need for a chromatographic step[35]. The sensitivity of these methods to identify the monoclonal light chain depends on the amount of the polyclonal background, but it is surely higher than those of protein electrophoresis or immunofixation. Their respective applications have recently been reviewed[36].
Studies on these methods continue and, in 2021, the IMWG Mass Spectrometry Committee, on the basis of literature evidence, made recommendations regarding their use in plasma cell diseases[37], stating that they can be used instead of immunofixation in the clinical management of the patients but did not encourage the use of MS as a substitute of the current immunochemical measurement of FLC in any plasma cell disease, including in amyloidosis.
TISSUE ANALYSIS
Congo red staining, dating back to 1922, is the main and oldest technique for detecting amyloid fibril deposits on formalin-fixed and paraffin-embedded (FFPE) tissue sections. Amyloid is evidenced as green birefringent deposits by using a polarized light microscope. This method has been further improved by using an alkaline staining solution saturated with sodium chloride. Fluorescent stains (thioflavin T or S) and metachromatic stains (crystal violet) are also used to detect tissue amyloid. Amyloid proteins are identified and classified on tissue sections by using specific antibodies raised against kappa or lambda Ig light chains and immunoperoxidase or indirect immunofluorescence techniques[38].
Accurate typing of amyloid deposits is the prerequisite for proper treatment. Immunohistochemistry is largely used to identify and characterize amyloid on tissues either in light microscopy (on FFPE tissues) by immunoperoxidase techniques or in electron microscopy (on glutaraldehyde fixed tissue samples) by post-embedding immunogold techniques. The introduction of mass spectrometry (MS) has been advocated as a potential way to define the type of amyloid fibrils overcoming the limits (i.e., sensitivity) and possible pitfalls (i.e., specificity) of antibody-based methods. The two main MS techniques are based on four fundamental steps: First, there is the digestion of all the proteins in the sample, usually by trypsin. Next, fragments of 5-25 amino acids (aa) need to be separated; the most common technique is liquid chromatography (LC). The solution is then exposed to high voltages to ionize the peptides. Tandem mass spectrometry (MS/MS) analysis consists of a measurement of the mass/charge (m/z), peptide fragmentation after collision with an inert gas, a technique called collision-induced fragmentation (CID), and a final MS measurement of the specific CID of the peptide, which allows finding the specific aa sequence. In the final step, results are compared with reference databases through bioinformatic algorithms, and the likelihood that each peptide is derived from an initial protein is obtained[39].
A novel technique involves cutting 10 mm tissue slices from FFPE specimens and isolating amyloid deposits through laser microdissection (LMD) using a microscope with a fluorescence module. LMD allows good separation of amyloid deposits from the background, which provides material suitable for the LC-MS/MS analysis, followed by bioinformatic analysis (sensitivity and specificity of 98%-100%)[40]. Another approach has been proposed[40]. Upon acquiring the proteome map of unfractionated tissue (usually fresh fat, although it can be performed on FFPE) by shotgun LC-MS/MS analysis, amyloid positive samples are compared with negative control tissue. Amyloid identification from the whole tissue proteome derives from a parameter, called alpha-value[40], quantifying the relative abundance of known amyloid proteins in patients versus controls.
The major limitation of both these latter options is the absence of information about the spatial distribution of the fibrils. A recent solution to this issue was the development of imaging-assisted MS. Matrix-assisted laser desorption/ionization mass spectrometry imaging coupled with ion mobility separation (MALDI-IMS MSI) has a 91% sensitivity and a 94% specificity to discriminate ATTR from AL-λ amyloidosis[41] [Figure 2].
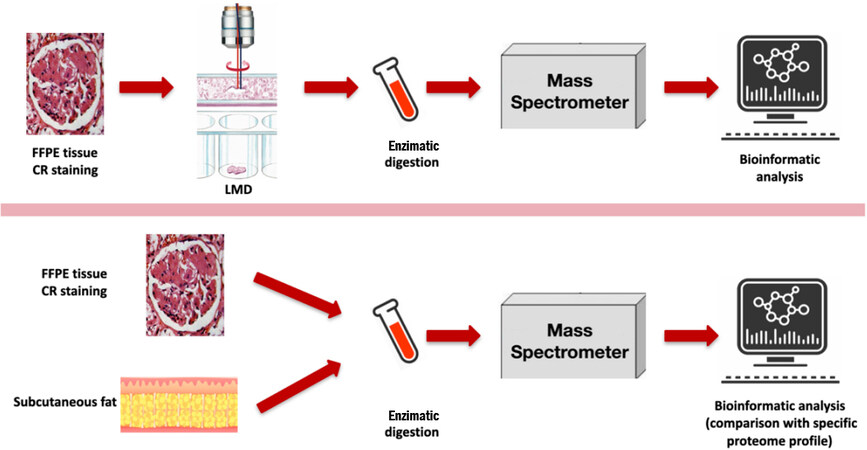
Figure 2. Application of proteomic analysis for amyloidosis typing. (top) Mayo Clinic technique from formalin-fixed and paraffin-embedded (FFPE) specimens. After Congo red (CR) staining, amyloid deposits are cut from tissue slices and undergo laser microdissection (LMD) with a fluorescence module leading to a strong enhancement of deposits. The material is then suitable for liquid chromatography and tandem mass spectrometry analysis followed by bioinformatic analysis. (bottom) Shotgun liquid chromatography and tandem mass spectrometry analysis. Semiquantitative label-free simultaneous comparison of the amyloid positive samples from both fresh fat and FFPE against an average map of negative control tissue. Amyloid identification is based on the estimation of the alpha value, representing the normalized relative abundance of each known amyloid protein compared to controls. Modified from[42].
By analyzing the whole tissue using shotgun proteomic techniques, it is possible to identify amyloidogenic fibrils only by the presence of specific proteins that frequently deposit with them: apolipoprotein E, serum amyloid P, and apolipoprotein IV[12].
Although MS constitutes an accurate diagnostic tool for AL amyloidosis, its cost and need for a highly qualified team impede its widespread distribution. In addition, the databases needed for the comparison and analysis of aa sequences are still under development.
RISK STRATIFICATION AND GUIDE TO TREATMENT
Risk stratification in AL amyloidosis relies on cardiac biomarkers [troponin T (TnT) and N-terminal pro-B-type natriuretic peptide (NT-ProBNP)] and dFLC. Stages from I to IV have been identified based on the combination of dFLC > 180 mg/L, TnT > 25 ng/L, and NT-ProBNP > 1800 ng/L[25,27]. In addition, patients with dFLC < 50 mg/L at the time of diagnosis generally have a better prognosis, independently of cardiac damage. FLC quantification can also allow monitoring of patient response to treatment. A decrease in serum FLC and dFLC as well as a normalization of the κ/λ FLC ratio, all predict a better outcome. The hematologic response can be classified into four categories: complete response (negative serum and urine and normal FLC ratio), very good partial response (dFLC < 40 mg/ L), partial response (dFLC decrease > 50%), and no response[26]. This classification distinguishes four groups with statistically differing survival rates. A score from 0 to 3 is assigned to these categories, 0 being the value for complete response and 3 for no response[26].
Organ response is classified with specific cut-off levels: kidney response manifests as a 30% reduction in 24 h urine protein excretion or as a 25% decrease in the estimated GFR from baseline[39]. Cardiac response presents as an NT-proBNP reduction of 30% combined with an absolute decrease of > 300 ng/L or a 30% reduction in BNP and > 50 ng/L below the starting value[39]. A score of 0 is assigned to a response in all involved organs, 1 for response in just one organ, and 2 for no organ response. As a consequence, patients can be assigned two scores: one to characterize their hematologic response alone and the other to characterize the responses of other organs. By summing these two scores, a composite hematologic and organ response (CHOR) score is defined with different therapeutic approaches and survival rates[39] [Table 2].
Criteria for organ and hematological response to monitor treatment efficacy in AL amyloidosis
| Category | |
| Hematological response (HR) | Complete response (CR): Negative serum and urine immunofixation and normalized free light-chain ratio Very good partial response (VGPR): dFLC decreased by 40 mg/L Partial response (PR): dFLC decreased by 50% |
| Organ response (OR) | Heart (BNP-based): BNP decreased by 30% and > 50 ng/L over the starting value. Baseline BNP must be ≥ 150 ng/L Heart (NT-proBNP based): Reduction of NT-proBNP of 30% and > 300 ng/L over the starting value. Baseline NT-proBNP has to be ≥ 650 ng/L Kidney: 30% reduction in 24 h urine protein excretion or protein excretion lower than 0.5 g per 24 h in the absence of progressive renal insufficiency, defined as a decrease in eGFR to 25% over baseline |
| Composite hematological and organ response (CHOR) model | CHOR Group 1 (score 0-3): Good prognosis CHOR Group 2 (score 4-5): Poor prognosis Patients are classified into CHOR groups according to a score based on HR and OR criteria Score for HR: CR, 0; VGPR, 1; PR, 2; no response, 3 Score for OR: Response in all organs involved, 0; response in at least one but not all the organs involved, 1; no organ response, 2 |
CONCLUSIONS
Serum FLCs are important tools for diagnosing AL amyloidosis, stratifying patient risk, and guiding treatment. Five assays are available. They are based on antigen-antibody recognition and produce different results, also depending on whether the FLCs are found in monomeric or dimeric forms. The main limitations are that the two most commonly used assays produce different results, and the Freelite® assay may even give different results according to the platform and technique used. The diagnosis of AL amyloidosis requires a tissue biopsy and the identification of AL amyloid through immunohistochemistry and possibly also proteomic techniques. When AL amyloidosis is diagnosed, accurate risk stratification is essential to define the treatment strategy, which relies crucially on circulating levels of FLCs. Finally, the changes of circulating FLCs over time are important indicators of response to treatment.
DECLARATIONS
Authors’ contributionsDrafted the paper: Camerini L, Aimo A
Critically revised the paper: Pucci A, Musetti V, Masotti S, Franzini M, Caponi L, Vergaro G, Castiglione V, Passino C, M, Clerico A
Availability of data and materialsNot applicable.
Financial support and sponsorshipNone.
Conflicts of interestAll authors declared that there are no conflicts of interest.
Ethical approval and consent to participateNot applicable.
Consent for publicationNot applicable.
Copyright© The Author(s) 2022.
REFERENCES
1. Porcari A, Bussani R, Merlo M, et al. Incidence and characterization of concealed cardiac amyloidosis among unselected elderly patients undergoing post-mortem examination. Front Cardiovasc Med 2021;8:749523.
2. Maurizi N, Rella V, Fumagalli C, et al. Prevalence of cardiac amyloidosis among adult patients referred to tertiary centres with an initial diagnosis of hypertrophic cardiomyopathy. Int J Cardiol 2020;300:191-5.
3. Quock TP, Yan T, Chang E, Guthrie S, Broder MS. Epidemiology of AL amyloidosis: a real-world study using US claims data. Blood Adv 2018;2:1046-53.
4. Brenner DA, Jain M, Pimentel DR, et al. Human amyloidogenic light chains directly impair cardiomyocyte function through an increase in cellular oxidant stress. Circ Res 2004;94:1008-10.
5. Rapezzi C, Merlini G, Quarta CC, et al. Systemic cardiac amyloidoses: disease profiles and clinical courses of the 3 main types. Circulation 2009;120:1203-12.
6. Lavatelli F, Imperlini E, Orrù S, et al. Novel mitochondrial protein interactors of immunoglobulin light chains causing heart amyloidosis. FASEB J 2015;29:4614-28.
7. Palladini G, Jaccard A, Milani P, et al. Circulating free light chain measurement in the diagnosis, prognostic assessment and evaluation of response of AL amyloidosis: comparison of Freelite and N latex FLC assays. Clin Chem Lab Med 2017;55:1734-43.
8. Mishra S, Guan J, Plovie E, et al. Human amyloidogenic light chain proteins result in cardiac dysfunction, cell death, and early mortality in zebrafish. Am J Physiol Heart Circ Physiol 2013;305:H95-103.
9. Diomede L, Rognoni P, Lavatelli F, et al. A Caenorhabditis elegans-based assay recognizes immunoglobulin light chains causing heart amyloidosis. Blood 2014;123:3543-52.
10. Levinson RT, Olatoye OO, Randles EG, Howell KG, DiCostanzo AC, Ramirez-Alvarado M. Role of mutations in the cellular internalization of amyloidogenic light chains into cardiomyocytes. Sci Rep 2013;3:1278.
11. Monis GF, Schultz C, Ren R, et al. Role of endocytic inhibitory drugs on internalization of amyloidogenic light chains by cardiac fibroblasts. Am J Pathol 2006;169:1939-52.
12. Brambilla F, Lavatelli F, Di Silvestre D, et al. Shotgun protein profile of human adipose tissue and its changes in relation to systemic amyloidoses. J Proteome Res 2013;12:5642-55.
13. Chang IC, Dispenzieri A, Scott CG, et al. Utility of the serum free light chain assay in the diagnosis of light chain amyloidosis in patients with heart failure. Mayo Clin Proc 2019;94:447-54.
14. Larsen JT, Kumar SK, Dispenzieri A, Kyle RA, Katzmann JA, Rajkumar SV. Serum free light chain ratio as a biomarker for high-risk smoldering multiple myeloma. Leukemia 2013;27:941-6.
15. Dispenzieri A, Kyle RA, Katzmann JA, et al. Immunoglobulin free light chain ratio is an independent risk factor for progression of smoldering (asymptomatic) multiple myeloma. Blood 2008;111:785-9.
16. Cotten SW, Shajani-Yi Z, Cervinski MA, Voorhees T, Tuchman SA, Korpi-Steiner N. Reference intervals and diagnostic ranges for serum free κ and free λ immunoglobulin light chains vary by instrument platform: Implications for classification of patient results in a multi-center study. Clin Biochem 2018;58:100-7.
17. Vercammen M, Meirlaen P, Broodtaerts L, Vande Broek I, Bossuyt X. Effect of sample dilution on serum free light chain concentration by immunonephelometric assay. Clin Chim Acta 2011;412:1798-804.
18. Schieferdecker A, Hörber S, Ums M, et al. Comparison of three different serum-free light-chain assays-implications on diagnostic and therapeutic monitoring of multiple myeloma. Blood Cancer J 2020;10:2.
19. Schieferdecker A, Hörber S, Ums M, et al. Comparison of three different serum-free light-chain assays-implications on diagnostic and therapeutic monitoring of multiple myeloma. Blood Cancer J 2020;10:2.
20. Muluhngwi P, Sharp CN, Pozzi N, Elin RJ, Jortani SA. Verification of newly FDA-approved kappa and lambda free light chain assays on a previously untested platform. J Appl Lab Med 2019;4:323-30.
21. Campbell JP, Heaney JL, Shemar M, et al. Development of a rapid and quantitative lateral flow assay for the simultaneous measurement of serum κ and λ immunoglobulin free light chains (FLC): inception of a new near-patient FLC screening tool. Clin Chem Lab Med 2017;55:424-34.
22. Jacobs JFM, de Kat Angelino CM, Brouwers HMLM, Croockewit SA, Joosten I, van der Molen RG. Evaluation of a new free light chain ELISA assay: bringing coherence with electrophoretic methods. Clin Chem Lab Med 2018;56:312-22.
23. Caillon H, Avet-Loiseau H, Attal M, Moreau P, Decaux O, Dejoie T. Comparison of sebia free light chain assay with freelite assay for the clinical management of diagnosis, response, and relapse assessment in multiple myeloma. Clin Lymphoma Myeloma Leuk 2019;19:e228-37.
24. Dispenzieri A, Kyle R, Merlini G, et al. International Myeloma Working Group. International Myeloma Working Group guidelines for serum-free light chain analysis in multiple myeloma and related disorders. Leukemia 2009;23:215-24.
25. Kumar S, Dispenzieri A, Lacy MQ, et al. Revised prognostic staging system for light chain amyloidosis incorporating cardiac biomarkers and serum free light chain measurements. J Clin Oncol 2012;30:989-95.
26. Palladini G, Dispenzieri A, Gertz MA, et al. New criteria for response to treatment in immunoglobulin light chain amyloidosis based on free light chain measurement and cardiac biomarkers: impact on survival outcomes. J Clin Oncol 2012;30:4541-9.
27. Caponi L, Koni E, Romiti N, Paolicchi A, Franzini M. Different immunoreactivity of monomers and dimers makes automated free light chains assays not equivalent. Clin Chem Lab Med 2018;57:221-9.
28. Caponi L, Koni E, Romiti N, Paolicchi A, Franzini M. Free light chain UV quantification compared with immunochemical measurement: how dimers and monomers may influence the results. Clin Chim Acta 2020;510:278-84.
29. Caponi L, Franzini M, Koni E, Masotti S, Petrini M, Paolicchi A. Discrepancy between FLC assays: only a problem of quantification? Clin Chem Lab Med 2016;54:1111-3.
30. Katzmann JA, Kyle RA, Benson J, et al. Screening panels for detection of monoclonal gammopathies. Clin Chem 2009;55:1517-22.
31. Dimopoulos M, Kyle R, Fermand JP, et al. International Myeloma Workshop Consensus Panel 3. Consensus recommendations for standard investigative workup: report of the International Myeloma Workshop Consensus Panel 3. Blood 2011;117:4701-5.
32. Barnidge DR, Tschumper RC, Theis JD, et al. Monitoring M-proteins in patients with multiple myeloma using heavy-chain variable region clonotypic peptides and LC-MS/MS. J Proteome Res 2014;13:1905-10.
33. Bergen HR 3rd, Dasari S, Dispenzieri A, et al. Clonotypic light chain peptides identified for monitoring minimal residual disease in multiple myeloma without bone marrow aspiration. Clin Chem 2016;62:243-51.
34. Barnidge DR, Dasari S, Botz CM, et al. Using mass spectrometry to monitor monoclonal immunoglobulins in patients with a monoclonal gammopathy. J Proteome Res 2014;13:1419-27.
35. Barnidge DR, Krick TP, Griffin TJ, Murray DL. Using matrix-assisted laser desorption/ionization time-of-flight mass spectrometry to detect monoclonal immunoglobulin light chains in serum and urine. Rapid Commun Mass Spectrom 2015;29:2057-60.
36. Murray DL. Bringing mass spectrometry into the care of patients with multiple myeloma. Int J Hematol 2022;115:790-8.
37. Murray DL, Puig N, Kristinsson S, et al. Mass spectrometry for the evaluation of monoclonal proteins in multiple myeloma and related disorders: an International Myeloma Working Group Mass Spectrometry Committee Report. Blood Cancer J 2021;11:24.
38. Pucci A, Aimo A, Musetti V, et al. Amyloid deposits and fibrosis on left ventricular endomyocardial biopsy correlate with extracellular volume in cardiac amyloidosis. J Am Heart Assoc 2021;10:e020358.
39. Brambilla F, Lavatelli F, Di Silvestre D, et al. Reliable typing of systemic amyloidoses through proteomic analysis of subcutaneous adipose tissue. Blood 2012;119:1844-7.
40. Winter M, Tholey A, Kristen A, Röcken C. MALDI mass spectrometry imaging: a novel tool for the identification and classification of amyloidosis. Proteomics 2017;17:1700236.
42. Emdin M, Vergaro G, Passino C. Amiloidosi cardiaca come si diagnostica, come si cura.
Cite This Article
Export citation file: BibTeX | RIS
OAE Style
Camerini L, Aimo A, Pucci A, Castiglione V, Musetti V, Masotti S, Caponi L, Vergaro G, Passino C, Clerico A, Franzini M, Emdin M. Serum and tissue light-chains as disease biomarkers and targets for treatment in AL amyloidosis. Vessel Plus 2022;6:59. http://dx.doi.org/10.20517/2574-1209.2022.06
AMA Style
Camerini L, Aimo A, Pucci A, Castiglione V, Musetti V, Masotti S, Caponi L, Vergaro G, Passino C, Clerico A, Franzini M, Emdin M. Serum and tissue light-chains as disease biomarkers and targets for treatment in AL amyloidosis. Vessel Plus. 2022; 6: 59. http://dx.doi.org/10.20517/2574-1209.2022.06
Chicago/Turabian Style
Camerini, Lara, Alberto Aimo, Angela Pucci, Vincenzo Castiglione, Veronica Musetti, Silvia Masotti, Laura Caponi, Giuseppe Vergaro, Claudio Passino, Aldo Clerico, Maria Franzini, Michele Emdin. 2022. "Serum and tissue light-chains as disease biomarkers and targets for treatment in AL amyloidosis" Vessel Plus. 6: 59. http://dx.doi.org/10.20517/2574-1209.2022.06
ACS Style
Camerini, L.; Aimo A.; Pucci A.; Castiglione V.; Musetti V.; Masotti S.; Caponi L.; Vergaro G.; Passino C.; Clerico A.; Franzini M.; Emdin M. Serum and tissue light-chains as disease biomarkers and targets for treatment in AL amyloidosis. Vessel Plus. 2022, 6, 59. http://dx.doi.org/10.20517/2574-1209.2022.06
About This Article
Copyright

Data & Comments
Data
0

 Cite This Article 18 clicks

 Like This Article 47
likes
Like This Article 47
likes


Comments
Comments must be written in English. Spam, offensive content, impersonation, and private information will not be permitted. If any comment is reported and identified as inappropriate content by OAE staff, the comment will be removed without notice. If you have any queries or need any help, please contact us at support@oaepublish.com.