
Echocardiography: an overview - Part II


Abstract
This review describes echocardiographic features of commonly encountered acyanotic congenital heart defects. Echo-Doppler features of lesions causing obstruction, namely aortic stenosis, aortic coarctation, stenosis of the pulmonary valve and pulmonary arteries were initially presented followed by discussion of lesions with left-to-right shunt namely, atrial and ventricular septal defects, patent foramen ovale, patent ductus arteriosus (PDA), and atrioventricular septal defect. A special section dedicated to evaluating hemodynamically significant PDAs in premature infants was also included. Coronary artery anomalies (both congenital and acquired) were reviewed at the conclusion of the paper.
Keywords
INTRODUCTION
In Part I of this review, principles of echo-Doppler, the method of performance of echocardiographic and Doppler studies, approaches for quantification of pulmonary artery (PA) pressure, appraisal of systolic function of the ventricles, and illustration of the utility of echocardiography in evaluating multiple neonatal issues were described. In this Part II, the author will present a succinct review of echocardiographic findings of commonly encountered acyanotic congenital heart defects (CHDs). Obstructive lesions will be reviewed first followed by left-to-right shunt lesions and then coronary artery abnormalities. A brief description of the anatomy of each defect will be presented first followed by the echocardiographic findings. Cyanotic CHDs will be reviewed in Part III of this series.
OBSTRUCTIVE LESIONS
Aortic stenosis
Stenosis of the aortic valve is the most common among the obstructive lesions of the outflow tract of the left ventricle (LV). The incidence of AS of valvar type varies from 5% to 6% of all subjects with congenital defects of the heart. The usual pathologic anatomy of aortic valve stenosis is the narrowing of the bicuspid valve. However, aortic valve with three cusps and infrequently, aortic valve with only one cusp (usually in neonates) have been known to cause aortic stenosis (AS)[1-3]. Varying extent of fusion of valve commissures has been reported producing varying degrees of aortic valve obstruction. Annular hypoplasia and dysplasia of aortic valve leaflets have also been documented, mostly in newborn and young babies. The aortic valve cusps are thick and non-pliable with doming. Hypertrophy of the left ventricular musculature in a concentric manner is seen, which is mostly proportionate to the severity of narrowing. Post-stenotic dilatation of the aorta (Ao) is observed in the majority of patients; the degree of such dilatation is not related to the degree of aortic valve obstruction[1-3].
Echocardiogram shows thickened aortic valve leaflets [Figures 1A and 2A], usually a bicuspid aortic valve [Figure 1B], and a domed aortic valve [Figure 1C]. Turbulent flow is demonstrated by color flow Doppler
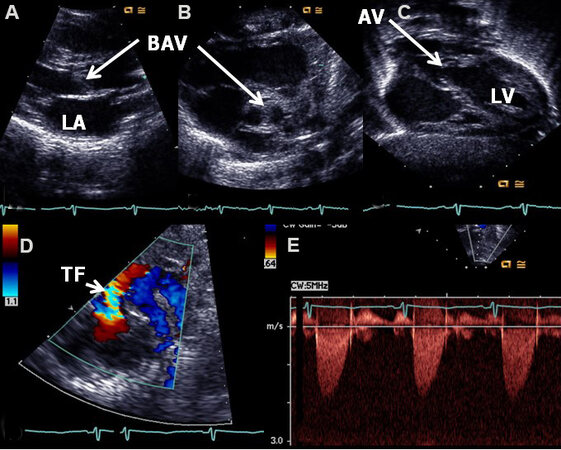
Figure 1. Echo-Doppler studies illustrating a thick (A) and bicuspid (B) aortic valve (BAV) with doming of the aortic valve (AV) (C). Color flow imaging demonstrates turbulent flow (TF) at the aortic valve (arrow) (D). The Doppler velocity via the AV is low (< 2 m/s) (E), suggesting trivial aortic stenosis with a bicuspid aortic valve. The left atrium (LA) and left ventricle (LV) are labeled. Reproduced from Ref.[4].
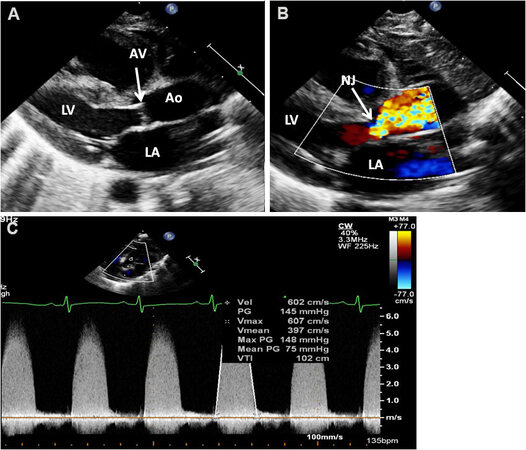
Figure 2. Echo-Doppler studies of a patient with severe aortic stenosis illustrating an aortic valve (AV) which is thick and domed (A). Color flow imaging demonstrates turbulent flow with a narrow jet (NJ) at the AV (arrow) (B). The Doppler velocity via the AV is high
Peak instantaneous gradient = 4V2
V, aortic valve peak Doppler velocity in m/s.
The velocity measurements are secured most often in parasternal or suprasternal notch views than from the apical view; however, most importantly one must use a view in which close alignment of the Doppler signal to the aortic flow can be achieved.
The Doppler peak instantaneous gradient does not truly indicate the true peak-to-peak systolic pressure gradient secured in the catheterization laboratory because of the pressure recovery phenomenon[5,6] and appropriate corrections to account for pressure recovery should be made during the calculations of the gradient. More recently, vector flow imaging (VFI), a real-time angle-independent ultrasound technique, has been used to assess the aortic gradients. VFI values seem to have a better correlation with catheter-measured gradients than conventional Doppler gradients; however, this observation is based on the study of a limited number of patients[7].
Other obstructions of the LV outflow tract may also occur at subvalvar (subaortic membranous stenosis
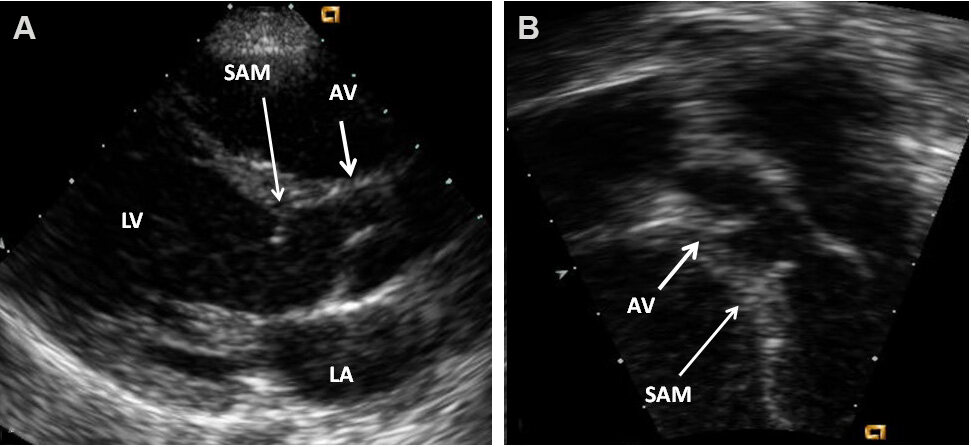
Figure 3. Echocardiographic studies in parasternal long-axis (A) and apical five-chamber (B) projections illustrating the subaortic membrane (SAM). The position of the aortic valve (AV) is shown. Continuous wave and color Doppler studies demonstrated elevated Doppler flow velocity across SAM, but are not shown in these echo frames. The left atrium (LA) and left ventricle (LV) are labeled. Reproduced from Ref.[4].
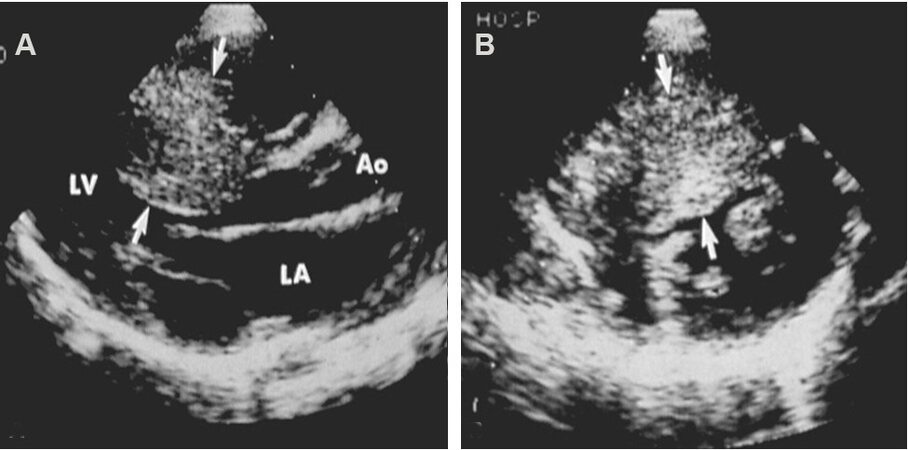
Figure 4. Echocardiographic studies in parasternal long (A) and short (B) axis projections illustrating severe thickening of the inter-ventricular septum (arrows), suggestive of hypertrophic cardiomyopathy. Continuous wave and color Doppler studies demonstrated elevated Doppler flow velocity across the left ventricular outflow tract at the level of thickened inter-ventricular septum (not shown). Aorta (Ao), left atrium (LA), and left ventricle (LV) are marked. Modified from Ref.[3].
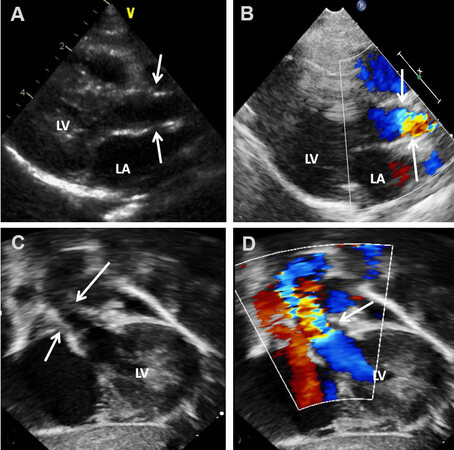
Figure 5. Echo-Doppler studies in parasternal long-axis (A, B) and subcostal (C, D) projections illustrating supravalvar aortic stenosis. Note that the stenosis is above the aortic valve as shown with arrows. Color flow imaging shows turbulence in the Doppler flow signal as pointed out with arrows (B, D). An increased Doppler flow velocity was recorded superior to the aortic valve but is not illustrated in the above echo frames. The left atrium (LA) and left ventricle (LV) are labeled. Reproduced from Ref.[4].
Echocardiographic evaluation is also valuable in assessing the outcome of surgical and balloon therapy; residual gradients and aortic insufficiency can be assessed[8].
Aortic coarctation
Aortic coarctation (AC) is a CHD in which constriction of the descending thoracic aorta occurs. The narrowed segment is made up of localized, thickened media with infolding along with the neointimal tissue[1,3,9,10]. This localized narrowing may involve a small segment of the aorta (discrete), or a long segment is involved; the discrete type has a higher frequency. The typical AC is positioned distal to the takeoff of the left subclavian artery and is generally described as juxtaductal. Hypoplasia of the transverse aortic arch and isthmus of the aorta of varying degrees is seen, mostly in symptomatic newborn and young babies. Post-stenotic dilatation of the descending aorta is uniformly observed in all AC patients. Collateral blood vessels connecting the vessels of the upper portion of the body to those of the lower part of the body are present in children, but are not typically seen in neonates[10]. The incidence of AC varies from 5% to 8% of all congenital cardiac defects, but the prevalence is higher in babies who present with symptoms during the neonatal period.
Two-dimensional (2D) imaging from the suprasternal notch along with Doppler interrogation are valuable in diagnosing AC by 2D [Figures 6A and 7A], by color Doppler flow acceleration [Figures 6B and 7B], and by demonstrating a jump in flow velocity magnitude from the aortic isthmus to the distal aorta [Figure 6C and D, Figures 8 and 9]. The peak instantaneous gradient across the AC may also be measured with the use of a simplified Bernoulli formula[11]. When Doppler flow velocity is recorded in the descending aorta (DAo) at the diaphragm, damped flow signal is seen [Figure 10]. Transverse aortic arch and aortic isthmic hypoplasia [Figure 11] of varying degrees are common in neonatal coarctations and such findings support the diagnosis of aortic coarctation.
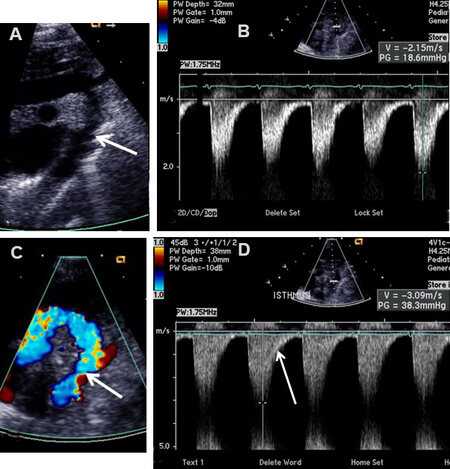
Figure 6. Echo-Doppler studies in suprasternal notch views in a patient with coarctation of the aorta; two-dimensional (A) and color Doppler (C) pictures reveal coarctation. The site of coarctation is pointed out by arrows in (A) and (C). The magnitude of flow velocity increases from the isthmic region of the aorta (B) to the descending aorta (D). Note that there is extension into the diastole of the Doppler signal as shown by the arrow in (D). Reproduced from Ref.[10].
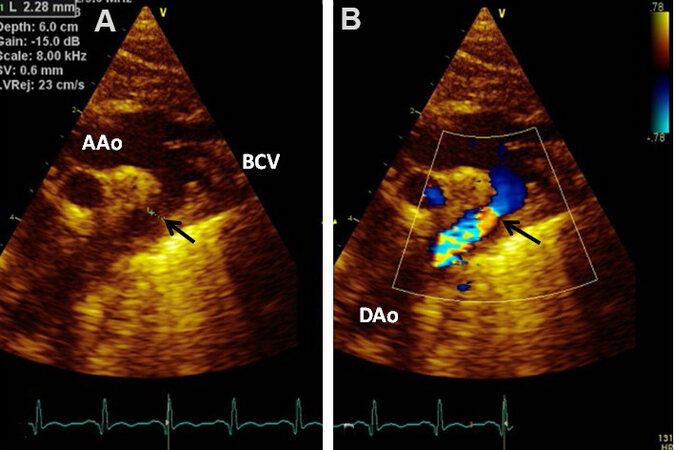
Figure 7. (A) Echocardiographic study in suprasternal notch view of a baby with coarctation of the aorta (arrow) by two-dimensional imaging is shown. (B) Color Doppler imaging illustrates flow turbulence at the location of the coarcted aortic segment as shown by the arrow. Ascending aorta (AAo), Brachiocephalic vessels (BCV), and descending aorta (DAo) are labeled. Reproduced from Ref.[10].
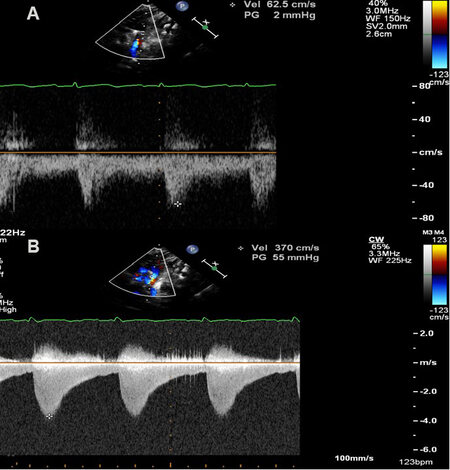
Figure 8. Selected video frames from Doppler recordings of the aortic arch demonstrating an increase in the peak Doppler velocity from the proximal aortic segment (A) to a segment below the site of aortic coarctation (B). Also note that there is diastolic extension of the Doppler flow signal (B); this would indicate that the aortic coarctation is of severe degree. Reproduced from Ref.[10].
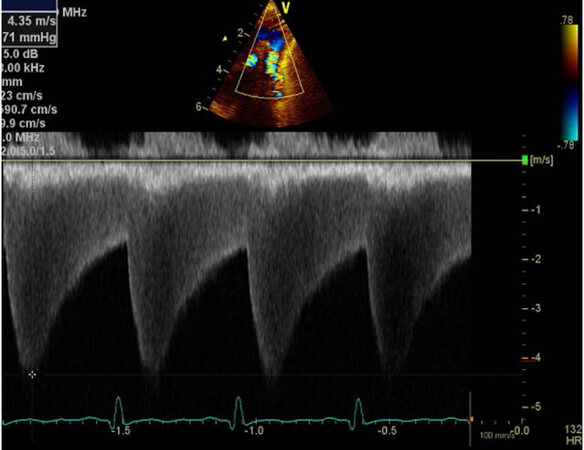
Figure 9. Selected video frame from Doppler recording from a suprasternal notch view of a continuous wave Doppler study. Both the high Doppler velocity and diastolic extension of the Doppler signal indicate that the aortic coarctation is severe in degree. Reproduced from Ref.[10].
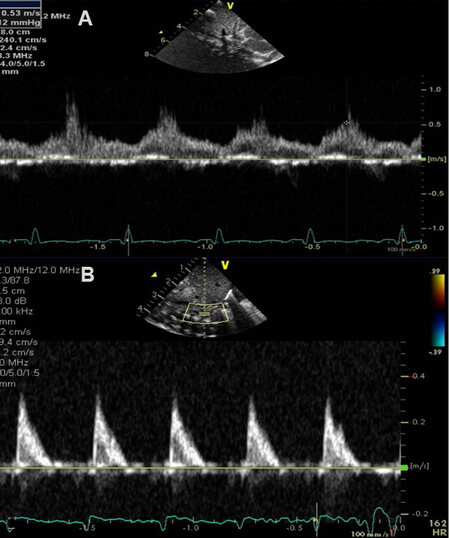
Figure 10. Selected video frames from Doppler recordings from subcostal views of two different patients. In (A), pulse Doppler recording of the abdominal aorta demonstrates damping of the flow velocity indicating coarctation of the aorta. In (B), a similar Doppler recording of a normal child illustrates a pulsatile signal with a high magnitude and arterial variety of flow signal with a sharp rise. Reproduced from Ref.[10].
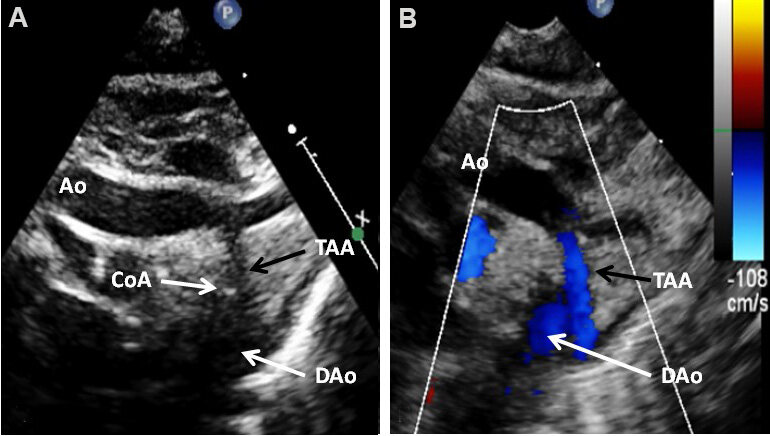
Figure 11. Echocardiographic study in suprasternal notch view imaging the arch of the aorta (Ao) by two-dimensional (A) and color Doppler (B) recording of a newborn baby who was diagnosed to have tricuspid atresia with transposition of the great arteries. These images illustrate coarctation of the aorta (CoA) and hypoplasia of the transverse portion of the aortic arch (TAA). Descending aorta (DAo) is labeled. Reproduced from Ref.[10].
The association of additional anomalies, namely, bicuspid aortic valve with or without aortic stenosis, mitral valve stenosis, ventricular septal defect (VSD), and patent ductus arteriosus (PDA) with AC is well known. Therefore, echocardiographic examination should exclude such anomalies.
It should be noted that diagnosis of AC is difficult in adults with poor echo windows and therefore, different types of imaging examinations, namely, magnetic resonance imaging or computed tomography, may have to be performed to firm up the diagnosis. Also, in situations where “low flow” situations occur secondary to heart failure, particularly in the neonate, the Doppler evaluation of the gradient may grossly under-estimate the true magnitude of obstruction.
Echocardiographic examination is commonly used for appraisal of the outcome of surgical therapy, balloon angioplasty, or stent implantation[12-14]; good results, residual obstructions or other complications, as the case may be, can be documented.
Pulmonary stenosis
In pulmonary stenosis (PS), the obstruction may occur at the valvar level, at the subvalvar region, at the supravalvar site, or in the branch PAs. Stenosis at the level of the pulmonary valve is utmost common among these obstructive lesions. Valvar PS accounts for 7.5% to 9.0% of all CHDs[1,3,15]. In subjects with PS at valvar level, thickening of pulmonary valve leaflets with valve leaflet fusion occurs. This results in a “dome shaped” pulmonary valve. Sometimes, bicuspid pulmonary valve may be seen, causing the obstruction. Right ventricular (RV) hypertrophy related to the magnitude of narrowing, and post-stenotic dilatation of the main PA, unrelated to the degree of PS, are observed[15].
Echo-Doppler studies demonstrate a domed and thickened pulmonary valve [Figures 12A and 13A] with turbulent flow by color flow Doppler imaging [Figures 12B and 13B] and augmented Doppler flow velocity magnitudes by pulsed [Figure 12C and D] and continuous wave [Figure 13C] Doppler. The peak Doppler velocities are utilized to compute the peak instantaneous gradients across the pulmonary valve utilizing a simplified Bernoulli formula:
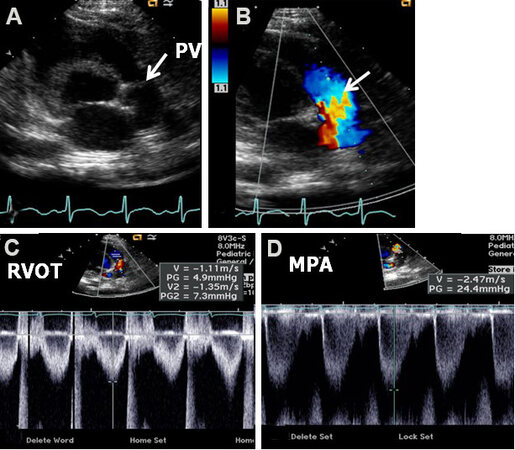
Figure 12. Echo-Doppler studies in parasternal short-axis views demonstrating features of mild pulmonary stenosis in a neonate. (A) Note somewhat domed pulmonary valve (PV) (arrow). (B) Flow acceleration at the PV level (arrow) is shown by color Doppler. (C) Right ventricular outflow tract (RVOT) Doppler flow velocity was normal at 1.1 m/s. (D) Mild increase in the Doppler flow velocity
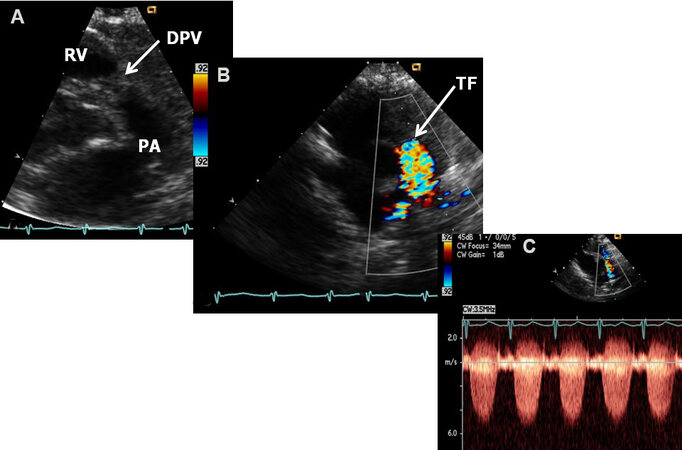
Figure 13. Echo-Doppler studies in parasternal short-axis views demonstrating features of severe pulmonary stenosis. (A) Note domed pulmonary valve (DPV) (arrow) which appears dysplastic. (B) Turbulent flow (TF) starts at the pulmonary valve level (arrow) as shown by color Doppler. (C) Severe increase in the Doppler flow velocity (in excess of 5.5 m/s) by continuous wave Doppler was seen across the pulmonary valve indicting severe (critical) pulmonary stenosis. PA: Pulmonary artery; RV: right ventricle. Reproduced from Ref.[16].
Peak instantaneous gradient = 4V2
V, maximum peak velocity via the pulmonary valve in m/s.
Other varieties of RV obstructions may also occur; these are: infundibular pulmonary stenosis, double-chambered RV, PA narrowing above the pulmonary valve (supravalvar) either isolated or in association with Williams syndrome, and distinct sub-pulmonary membranous stenosis (or other types of obstruction) in the morphological LV (positioned on the right) of congenital corrected transposition of the great arteries[15]; but these are relatively rare and will not be reviewed. However, branch PA stenosis is relatively frequent and will be briefly reviewed.
The utility of echo-Doppler studies in evaluating immediate [Figures 14-17] and follow-up [Figures 16-18] results after balloon pulmonary valvuloplasty[17-20] and surgery is well established.
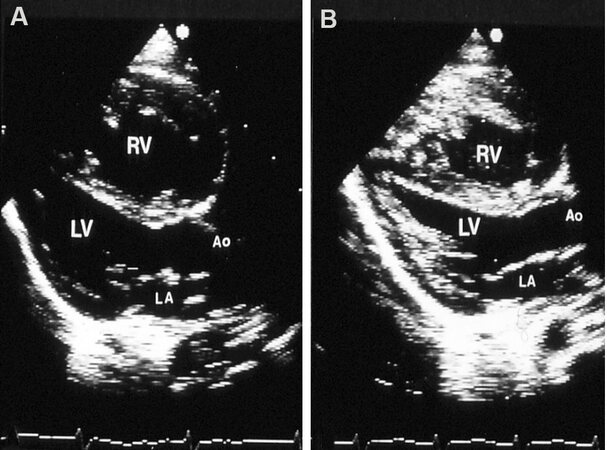
Figure 14. Two-dimensional echocardiographic studies in parasternal long-axis view before (A) and after (B) balloon pulmonary valvuloplasty, illustrating a reduction in the size of the right ventricle (RV). Aorta (Ao), left atrium (LA), and left ventricle (LV) are labeled. Reproduced from Ref.[17].
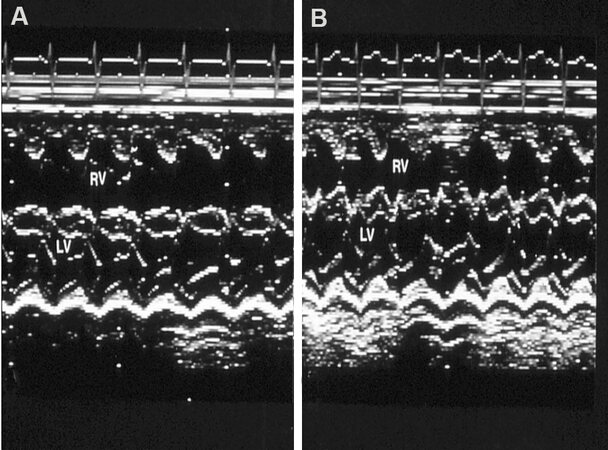
Figure 15. M-mode echocardiographic tracings in parasternal long-axis view before (A) and after (B) balloon pulmonary valvuloplasty, illustrating a reduction in the size of the right ventricle (RV). The left ventricle (LV) is labeled. Reproduced from Ref.[17].
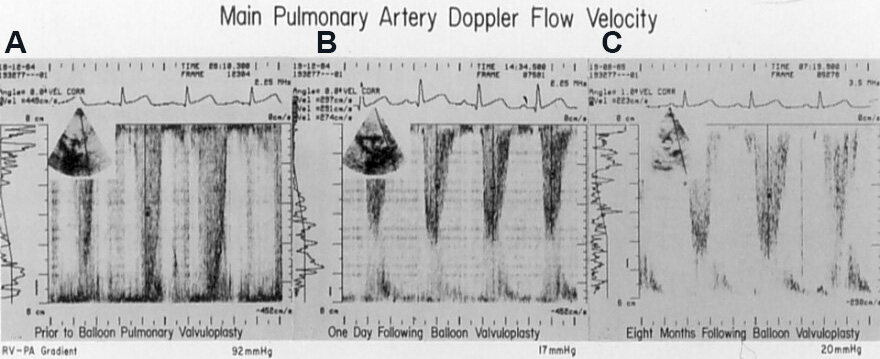
Figure 16. Doppler echocardiographic studies in parasternal long-axis view before (A), the day after (B), and 8 months (C) following balloon pulmonary valvuloplasty (BPV), illustrating a marked reduction in the peak Doppler flow velocity and peak instantaneous gradient from 92 mmHg to 17 mmHg immediately following BPV (A, B). The residual gradient was small (20 mmHg) eight months after BPV (C). Reproduced from Ref.[18].
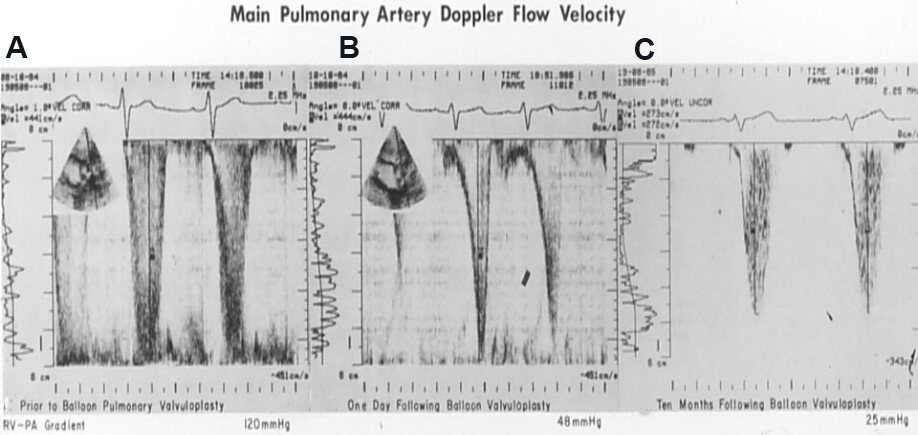
Figure 17. Doppler echocardiographic studies in parasternal long-axis view before (A), the day after (B), and 10 months after (C) balloon pulmonary valvuloplasty (BPV). While there was a substantial reduction in peak Doppler flow velocity (and calculated gradients from 120 mmHg to 48 mmHg) immediately following BPV (A vs. B), there was a residual 48 mmHg gradient; more importantly distinctive triangular pattern, indicative of infundibular obstruction remained (B). The residual gradient at ten months following BPV was low (25 mmHg) without the triangular pattern, suggesting that the infundibular narrowing has resolved (C). The residual peak gradients are printed at the lower portion of each panel. Reproduced from Ref.[18].
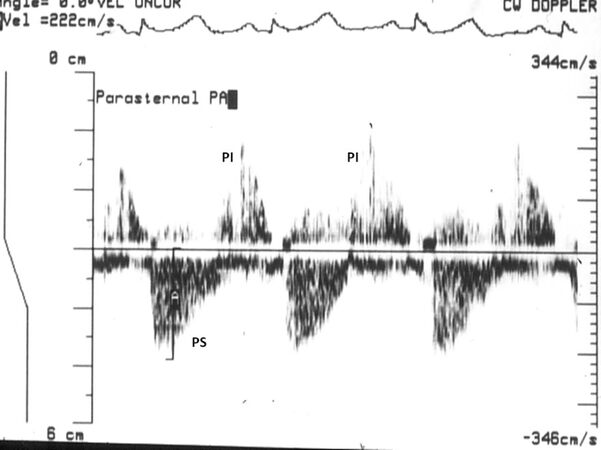
Figure 18. Doppler echocardiographic study in parasternal long-axis view during follow-up after balloon pulmonary valvuloplasty. Residual mild pulmonary stenosis (PS) and pulmonary insufficiency (PI) are illustrated. Reproduced from Ref.[17].
Branch pulmonary artery stenosis
In utero, most of the RV output is ejected into the Ao through the ductus arteriosus[21-24]. Only 7% of the output from both the ventricles is pumped into the lungs. Consequently, the PA branches are small in diameter. After the baby is born, the pulmonary vascular resistance decreases and the ductus arteriosus closes; these changes will result in augmented pulmonary blood flow. In an attempt to adapt to this augmented pulmonary blood flow, the flow velocity in the branch PAs increases, which in turn causes turbulence in the PA branches. These flow dynamics produce cardiac murmurs. As the infant grows, the branch PAs become larger in diameter and the physiologic branch PA stenosis disappears.
Neonates with branch PA stenosis generally exhibit cardiac murmurs that are auscultated at the left upper sternal border. This murmur radiates into the axillae and back. Alternatively, the branch PA stenosis may be identified during echocardiograms performed for some other indication. These babies have no other symptoms and generally have no other abnormal heart findings. Echo-Doppler studies show fairly small branch PAs [Figure 19] and elevated Doppler flow velocities across the branch PAs [Figure 19C-E].
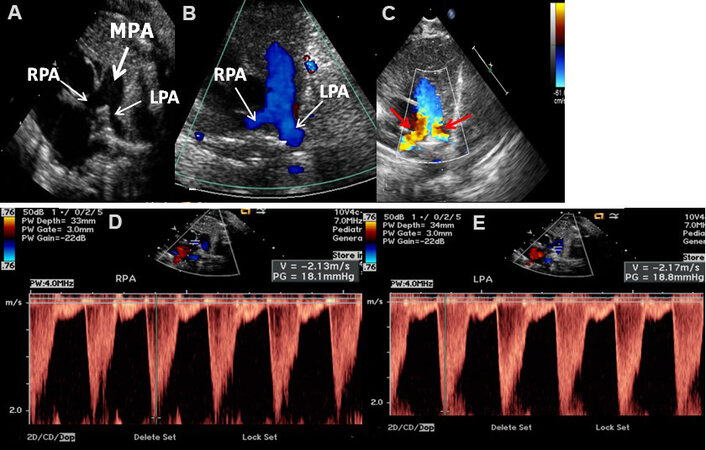
Figure 19. Echo-Doppler studies in parasternal short-axis views of two different newborn babies imaging the main (MPA), left (LPA), and right (RPA) pulmonary arteries. Two-dimensional (A) and color Doppler (B) imaging show adequate-sized RPA and LPA (A) with laminar flow (B); these data would indicate normal branch PAs. In a different newborn baby who presented with an ejection systolic murmur heard at the left upper sternal border radiating into the axillae and back, echo-Doppler studies demonstrated turbulent flow indicated by red arrows in (C). Doppler sampling of the branch PAs showed elevated Doppler flow velocities (> 2.1 m/s) in both the branch PAs (D, E), indicating peripheral pulmonary artery stenosis. This is generally considered physiologic and spontaneous resolution with time is expected. Reproduced from Ref.[16].
LEFT-TO-RIGHT SHUNT LESIONS
Atrial septal defect
There are several varieties of atrial septal defects (ASDs), and these are: ostium secundum, ostium primum, sinus venosus, and coronary sinus ASDs[24,25]. Another atrial defect is the patent foramen ovale (PFO)[24,25]. Ostium secundum ASDs are the most frequent among ASDs and comprise 8% to 13% of all CHDs. In subjects with ostium secundum ASD, a lack of atrial septal material in the fossa ovalis area is seen. The atrial defects range from small to large in size. These are usually single defects, although, on occasion, fenestrated or multiple defects are present. Shunting across the ASD [from the left atrium (LA) to the right] produces dilation of the right atrium (RA) and RV. The PAs are similarly dilated. Pulmonary hypertensive changes do not generally occur until late adult life[24,25].
Echo-Doppler examination shows dilated RA, RV and PAs [Figure 20] with paradoxical ventricular septal movement, well demonstrated on M-mode tracings [Figure 21A]. By 2D echo, the ASD can be clearly seen
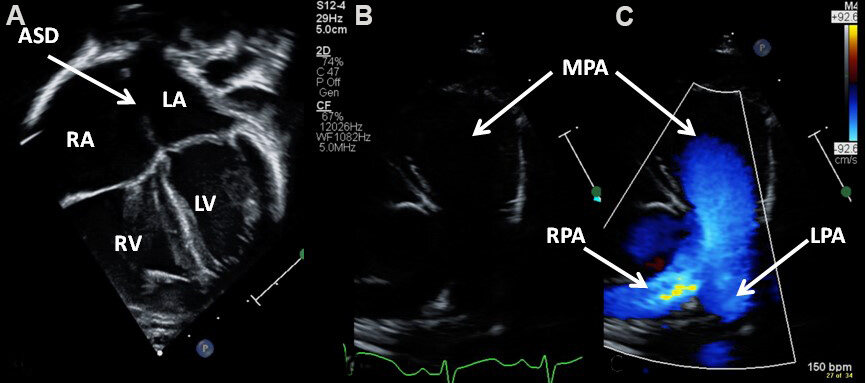
Figure 20. Echo-Doppler studies in apical four-chamber (A) and precordial short-axis (B, C) projections of a child with an atrial septal defect (ASD) demonstrating dilation of the right atrium (RA), right ventricle (RV), and main (MPA), left (LPA), and right (RPA) pulmonary arteries. The left atrium (LA) and left ventricle (LV) are labeled.
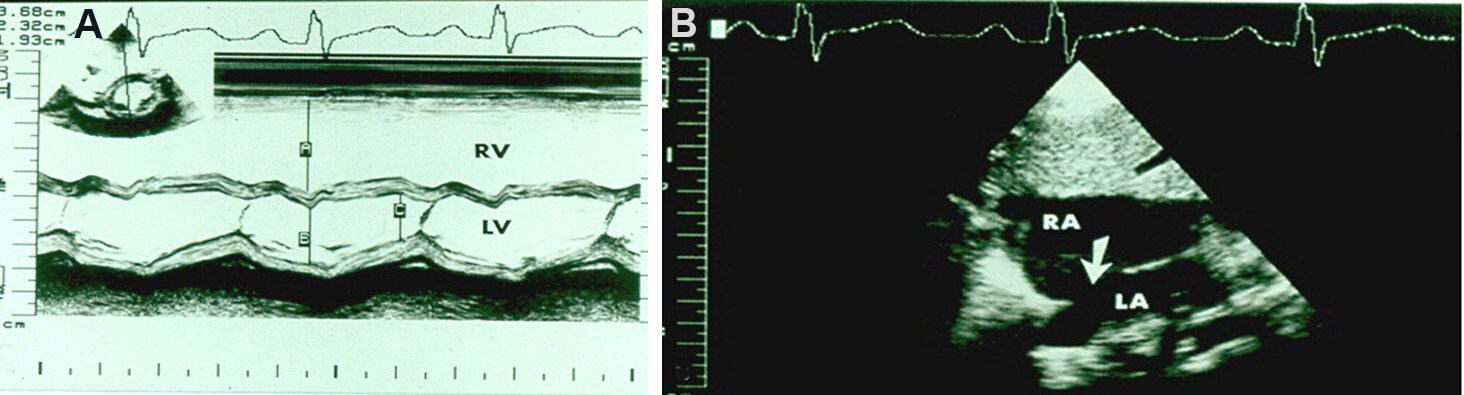
Figure 21. (A) M-mode echocardiogram of a child who was diagnosed to have an atrial septal defect (ASD). It shows dilatation of the right ventricle (RV) and paradoxical movement of the ventricular septum in the 2D-derived M-mode recording in parasternal short-axis view (see lower insert). The findings are very typical indirect signs of an ASD. (A-C) Stand for measurements of the RV in end-diastole, left ventricle (LV) in end-diastole, and LV in end-systole, in that order. The dimensions are listed in the top left insert. (B) Two-dimensional echocardiographic study of the same child shown in (A) evidently shows the ASD (arrow). The left atrium (LA) and right atrium (RA) are labeled. Reproduced from Ref.[24].
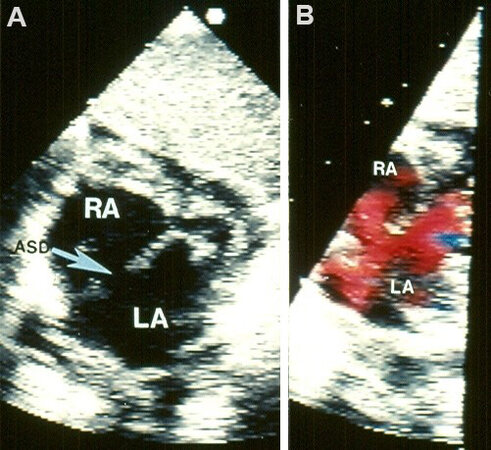
Figure 22. Selected video frames from an echocardiographic study in a subcostal view of a child illustrating an atrial septal defect (ASD) (arrow in A) with good septal rims. (B) Illustrates left-to-right shunt across the ASD. The left atrium (LA) and right atrium (RA) are marked. Reproduced from Ref.[3].
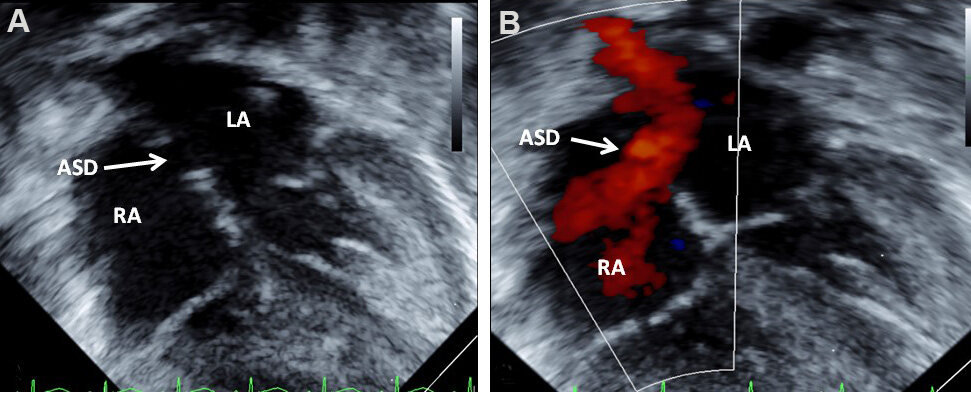
Figure 23. Two-dimensional echocardiograms without (A) and with color flow imaging (B) in subcostal long-axis view of the atrial septum, demonstrating an atrial septal defect (ASD) (arrow in A) with left-to-right shunt (arrow in B). The left atrium (LA) and right atrium (RA) are marked. Reproduced from Ref.[17].
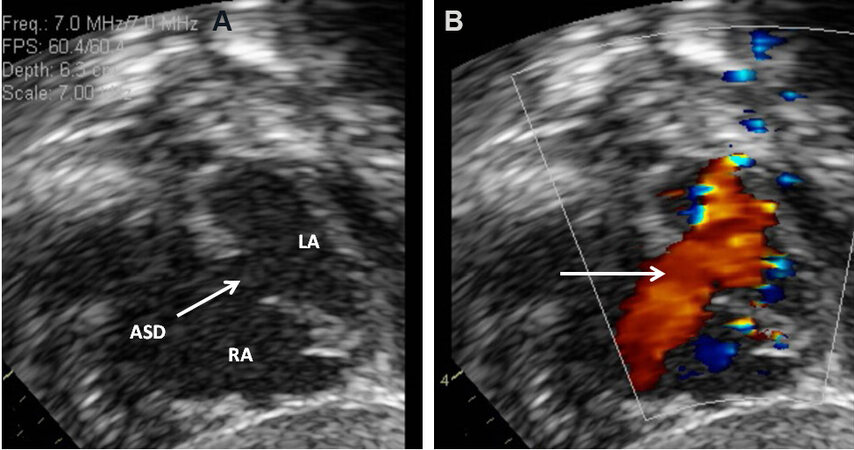
Figure 24. Two-dimensional echocardiograms without (A) and with color flow imaging (B) in subcostal short-axis views of the atrial septum, demonstrating an atrial septal defect (ASD) (arrow in A) with a left-to-right shunt (arrow in B). The left atrium (LA) and right atrium (RA) are marked. Reproduced from Ref.[16].
The 2D study is also useful in defining the atrial septal rims [Figures 25 and 26] for suitability of transcatheter device occlusion, although TEE or ICE in the catheterization laboratory is usually utilized for this purpose.
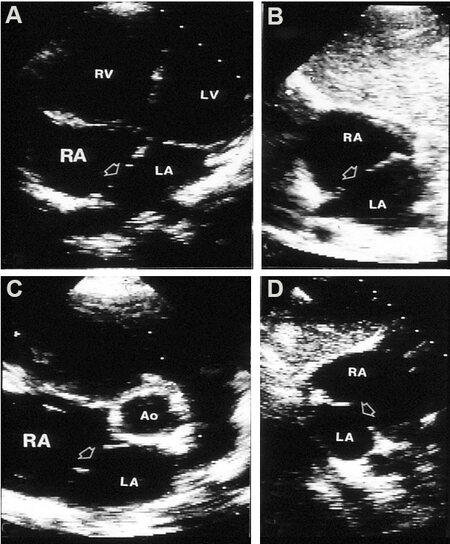
Figure 25. Two-dimensional echocardiograms of an atrial septal defect (ASD) to illustrate the atrial septal rims in apical four-chamber (A), subcostal long-axis (B), parasternal short-axis (C), and subcostal short-axis (D) views. The unfilled arrows point to the ASD. Adequate-sized septal rims are seen in each image. This patient is deemed to be an appropriate patient for percutaneous occlusion. Reproduced from Ref.[26]. Ao: Aorta; LA: left atrium; LV: left ventricle; RA: right atrium; RV: right ventricle.
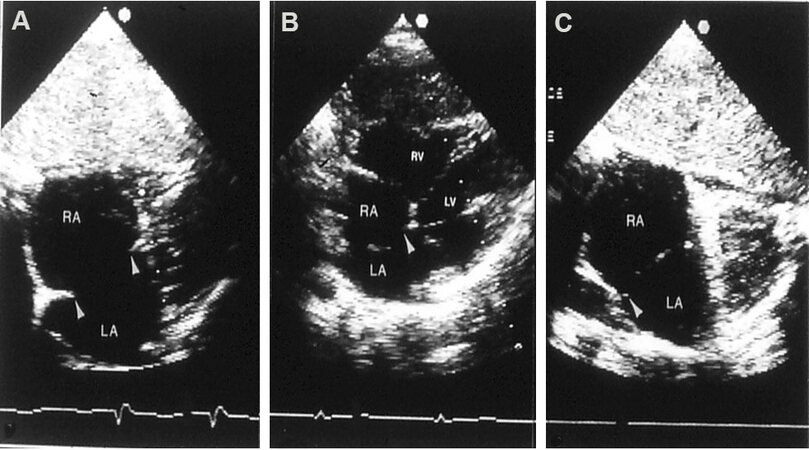
Figure 26. Two-dimensional echocardiograms of atrial septal defects (ASDs) in three different patients to illustrate deficient atrial septal margins. In (A) both the inferior and superior rims are small, in (B) the inferior margin is deficient, and in (C) the superior margin is tiny; the rims are shown with arrowheads. These ASDs are considered unsuitable for transcatheter occlusion because the rims of the atrial septum are inadequate for the device to achieve a good grasp on the atrial septum. Left atrium (LA), left ventricle (LV), right atrium (RA), and right ventricle (RV) are marked. Reproduced from Ref.[27].
Since there is an increased prevalence of deficient atrial septal rims, particularly in large ASDs[28,29], a careful evaluation of septal rims by TEE [Figure 27] or ICE should be performed in the catheterization laboratory prior to device implantation.
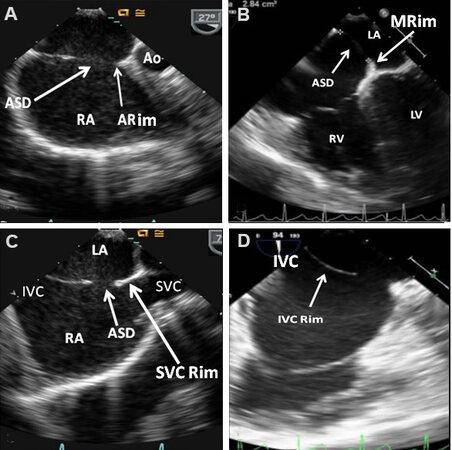
Figure 27. Transesophageal echocardiographic studies of the atrial septum demonstrating aortic (ARim), mitral (MRim), superior vena caval (SVC Rim), and inferior vena caval (IVC Rim) rims in sort axis (A) four-chamber (B) and bi-caval (C, D) views, respectively. Aorta (Ao), atrial septal defect (ASD), inferior vena cava (IVC), left atrium (LA), left ventricle (LV), right atrium (RA), right ventricle (RV), and superior vena cava (SVC) are labeled.
Echocardiography is also useful in demonstrating the effectiveness of device occlusion [Figures 28-32] and detecting residual shunts [Figure 33].
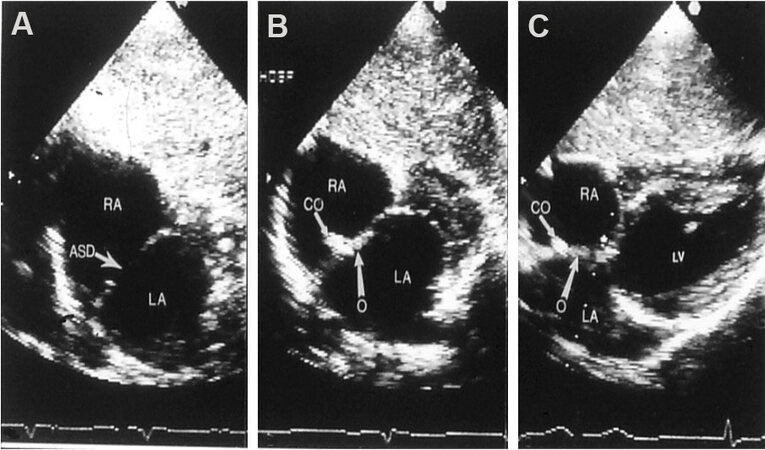
Figure 28. Echocardiographic images in subcostal echo projections of the atrial septum illustrating an atrial septal defect (ASD) (arrow in A) before ASD occlusion (A) and placement of a buttoned device across the ASD several hours (B) and 3 months (C) following device deployment. The long arrows in (C) identify the occluder (O) on the left atrial (LA) side and the shorter arrows point out the counter-occluder (Co) on-end in the right atrium (RA). The left ventricle (LV) is marked. Reproduced from Ref.[27].
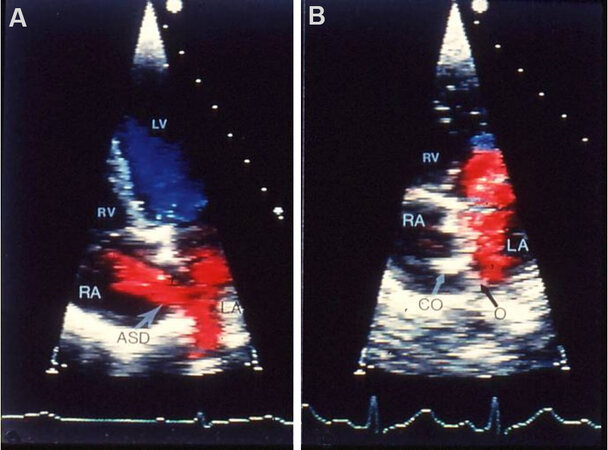
Figure 29. Echo-Doppler images of the atrial septum in apical four-chamber projections illustrating left-to-right shunt across an atrial septal defect (ASD) before (A) and 3 months following (B) deployment of a buttoned device. No residual shunt is observed in (B). A black arrow shows the occluder (O) on the left atrial (LA) and a white arrow shows the counter-occluder (CO) end in the right atrial (RA) side of the atrial septum. The left ventricle (LV) and right ventricle (RV) are labeled. Reproduced from Ref.[27].
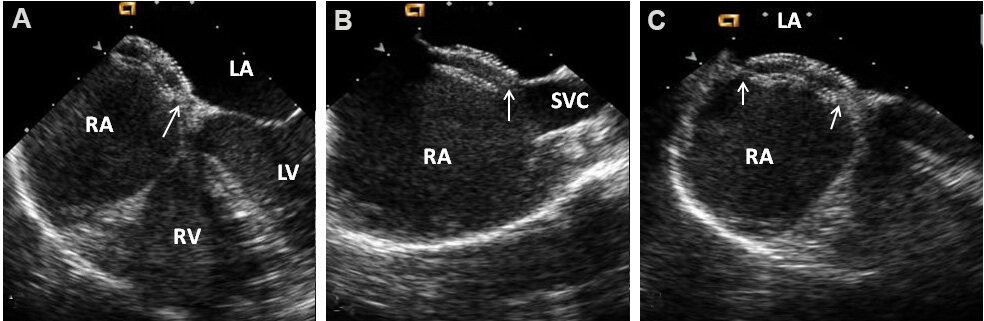
Figure 30. Transesophageal echocardiographic images after the deployment of an Amplatzer Septal Occluder to close an atrial septal defect (ASD), illustrating the position of both discs in four-chamber (A), bi-caval (B) and long-axis (C) projections. It is important to ensure that the rims of the ASD (arrows) are sandwiched between the left atrial (LA) and right atrial (RA) discs. The left ventricle (LV), right ventricle (RV), and superior vena cava (SVC) are marked. Reproduced from Ref.[30].
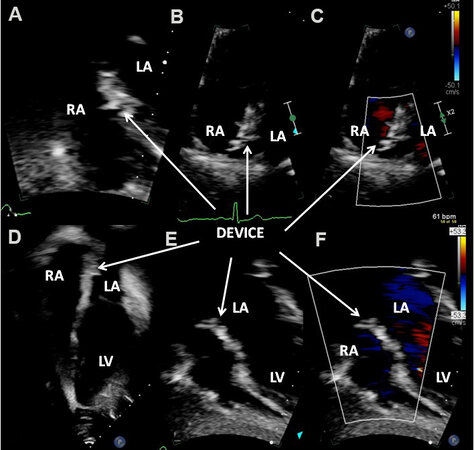
Figure 31. Echo-Doppler studies in subcostal (A, E and F) and apical four-chamber (B-D) projections of the atrial septum, demonstrating GORE® CARDIOFORM ASD Occluder device across the atrial septal defect three months after the device implantation; note excellent positioning of the device (DEVICE) without residual shunt (C, F). The left atrium (LA), left ventricle (LV), and right atrium (RA) are labeled.
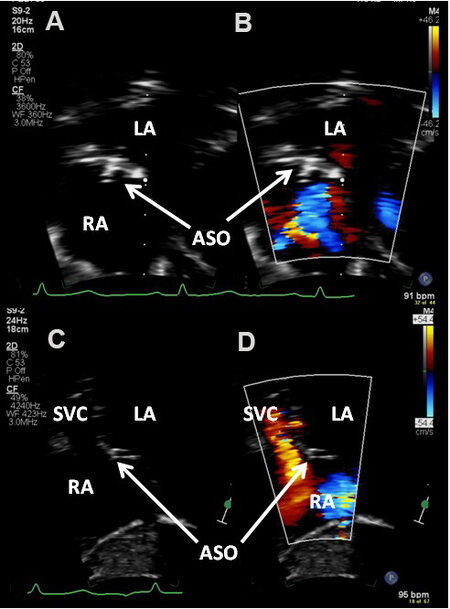
Figure 32. Echo-Doppler studies in subcostal long (A, B) and short (C, D) axis projections of the atrial septum, demonstrating Amplatzer Septal Occluder (ASO) device across the atrial septal defect three years after the device implantation; note excellent positioning of the ASO device (A-D) without residual shunt (B, D). Left atrium (LA), right atrium (RA), and superior vena cava (SVC) are labeled.
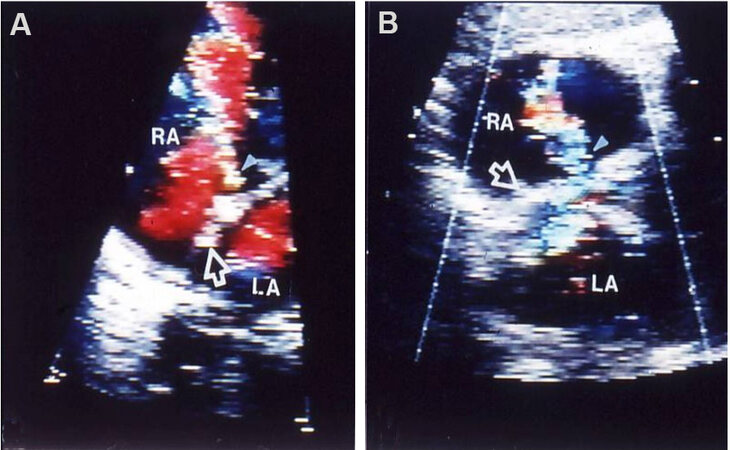
Figure 33. Echo-Doppler studies in subcostal projections of the atrial septum with color flow Doppler illustrating the buttoned device (unfilled arrowheads) across atrial septal defects in two children (A) and (B) with residual shunts (filled arrowheads). The left atrium (LA) and right atrium (RA) are marked. Reproduced from Ref.[31].
The effectiveness of surgical closure can also be demonstrated in echocardiographic studies [Figure 34].
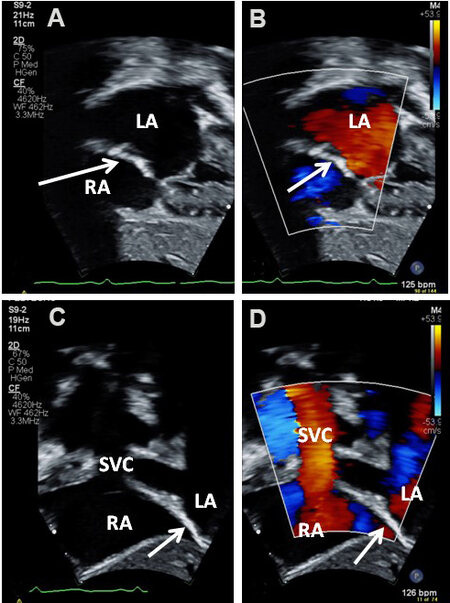
Figure 34. Echo-Doppler studies in subcostal long (A, B) and short (C, D) axis projections of the atrial septum demonstrating intact atrial septum (A-D) and no residual shunt (B, D) across the atrial septum. A large atrial septal defect was surgically repaired with a patch one year prior to this echocardiographic study. The arrows in (A)-(D) point to the echogenic patch used to close the atrial septal defect. Left atrium (LA), right atrium (RA), and superior vena cava (SVC) are labeled.
Other types of ASDs such as ostium primum [Figures 35 and 36], sinus venosus [Figure 37], and coronary sinus defects can generally be shown by echocardiographic studies[23,24].
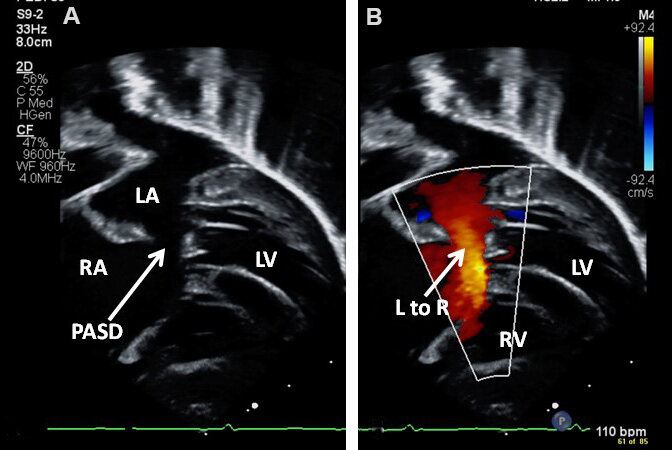
Figure 35. Echo-Doppler studies in modified subcostal four-chamber projections demonstrating an ostium primum atrial septal defect (PASD) (A) with shunting from the left (LA) to the right (RA) atrium (arrow in B). The left ventricle (LV) and right ventricle (RV) are labeled.
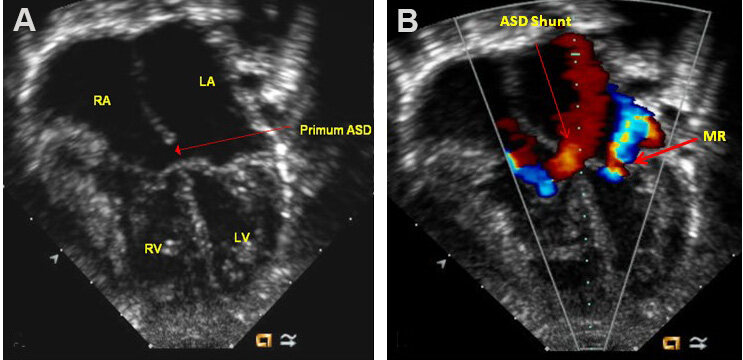
Figure 36. Two-dimensional (A) and color Doppler (B) images from apical four-chambered views demonstrating an ostium primum atrial septal defect (Primum ASD) (long red arrow in A) with a left-to-right shunt (long red arrow in B). Mitral regurgitation (MR) jet is marked in (B) (thick red arrow). The left atrium (LA), left ventricle (LV), right atrium (RA), and right ventricle (RV) are marked. Modified from Ref.[24].
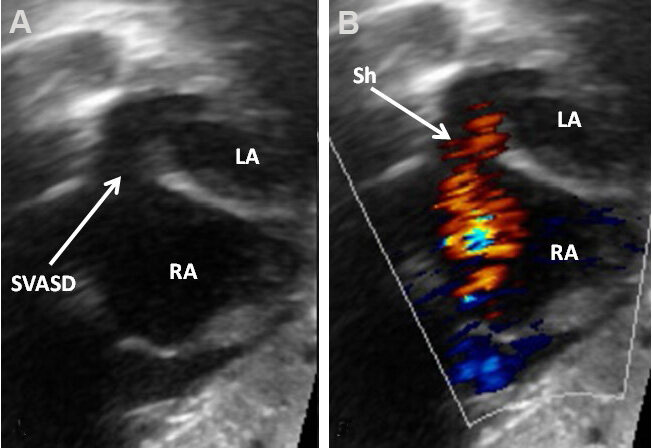
Figure 37. Two-dimensional (A) and color Doppler (B) images from subcostal views demonstrating a sinus venosus atrial septal defect (SVASD) in 2D (arrow) (A) with a left-to-right shunt (Sh) (arrow in B). Left atrium (LA) and right atrium (RA) are marked. Modified from Ref.[16].
In patients with ostium primum ASD, there is usually an associated cleft mitral valve, best demonstrated in apical short-axis view [Figure 38]. Mitral regurgitation is shown by color Doppler [Figure 36]. The sinus venosus ASDs are usually divided into superior vena caval (SVC) and inferior vena caval (IVC) types. In a high proportion of sinus venosus ASDs, anomalous connection of the right upper (SVC type) or right lower (IVC type) pulmonary vein is seen. Sometimes, the entire right lung may drain anomalously. Consequently, the echocardiographer should attempt to define the site of entry of all pulmonary veins in subjects with sinus venosus ASD.
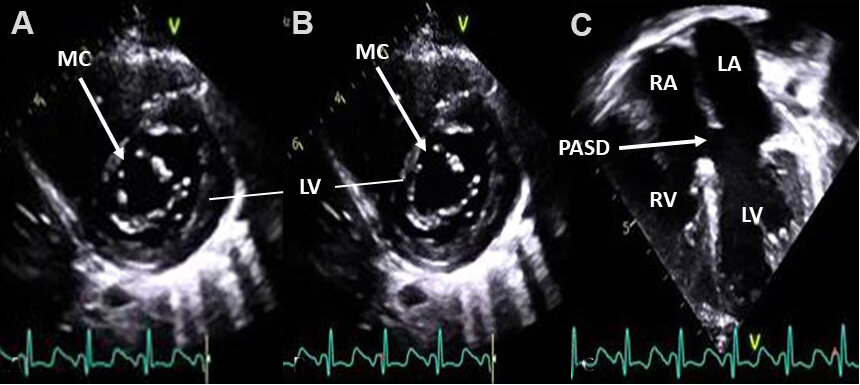
Figure 38. Selected video frames from apical short-axis (A, B) and apical four-chambered (C) views, illustrating mitral valve cleft (MC) (arrows in A, B) in two separate stages of cardiac contraction in a patient with an ostium primum atrial septal defect (PASD) (C). Left atrium (LA), left ventricle (LV), right atrium (RA), and right ventricle (RV) are marked.
Patent foramen ovale
In the fetus, the foramen ovale (FO) is patent widely due to streaming of the blood from the IVC into the LA, thus facilitating the supply of oxygen-enriched blood to vital fetal structures, namely, the heart and brain[21-23]. Following birth, an increased left atrial volume and pressure due to augmented pulmonary flow along with a decrease in the RA volume and pressure secondary to the expulsion of the placenta, results in an approximation of the septum primum against the septum secundum; these events cause functional occlusion of the FO. Ultimately, anatomic occlusion ensues in the majority of normal persons. While such closures are anticipated to occur, the PFOs are seen in almost a third of the normal people[32] and are considered to be usual (normal) variants. The prevalence of PFOs is even higher in neonates. Patients with isolated PFOs do not have any symptoms, and the PFO is usually identified during echocardiographic examination [Figure 39] carried out for a different indication.
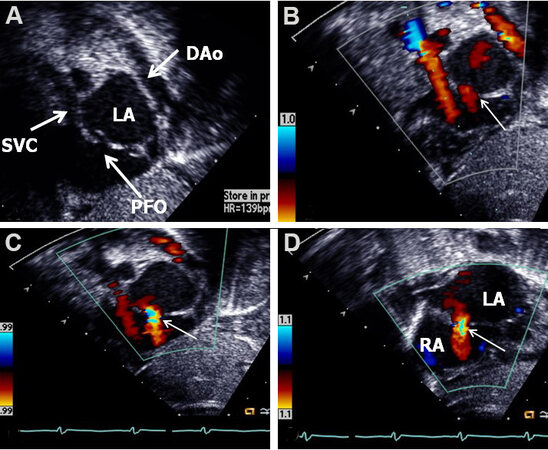
Figure 39. Two-dimensional (A) and color Doppler (B, C and D) images from subcostal short-axis views of the atrial septum demonstrating a patent foramen ovale (PFO) (arrow in A) with a left-to-right shunt (thin arrows in B, C and D). Note the overlapping of the septum primum over the septum secundum in (A), suggesting that this atrial defect is a PFO. Descending aorta (DAo), left atrium (LA), right atrium (RA), and superior vena cava (SVC) are marked. Reproduced from Ref.[16].
However, PFOs may gain significance later in life, in that they are assumed to be the location for paradoxical embolism, producing cerebro-vascular accidents or transient ischemic attacks; platypnea-orthodeoxia syndrome; continual right-to-left shunt in formerly treated complex cyanotic CHDs; Caisson’s disease (decompression illness); and migraine, as reviewed elsewhere[25,31], and may deserve special consideration at that time. Contrast echocardiography while injecting agitated saline or a similar contrast material and transcranial Doppler techniques are used to detect these shunts. A review of these methods is outside the scope of this paper.
Ventricular septal defect
VSD is the most frequently occurring CHD (bicuspid aortic valve is an exception), comprising 20% to 25% of all congenital cardiac defects. VSDs are categorized based on their position in the ventricular septum. Perimembranous defects are the most common (80%) and are located in the membranous portion of the ventricular septum, in the subaortic area[3,24]. Supracristal defects (5%-7%) are sited in the conal septum beneath the pulmonary valve. The next type is atrio-ventricular (AV) septal defects (AVSDs) (8%), which are positioned in the inlet ventricular septum. Muscular VSDs (5%-20%) are the most common defects in the neonate and are placed in the muscular inter-ventricular septum, some in the apical part of the ventricular septum. When multiple muscular VSDs are present, they are called “Swiss-cheese” defects. VSD sizes vary from small to medium and large.
Echo-Doppler studies demonstrate enlarged LA and LV; the magnitude of this enlargement is proportional to the dimension of the VSD[33]. The size and location of the VSD can be shown on 2D imaging [Figures 40 and 41]. The relationship of the VSD with aortic valve annulus should be assessed. Color flow imaging illustrates shunt from the LV to RV via the VSD [Figures 40-44]. Aneurismal development of the membranous septum causing spontaneous closure of the VSD can also be demonstrated [Figures 41C, 45A and Figure 46]. While the spontaneous closure of the VSD most commonly takes place by aneurismal formation using tricuspid valve tissue, sometimes the aortic valve leaflets prolapse into the VSD to close it, causing aortic insufficiency.
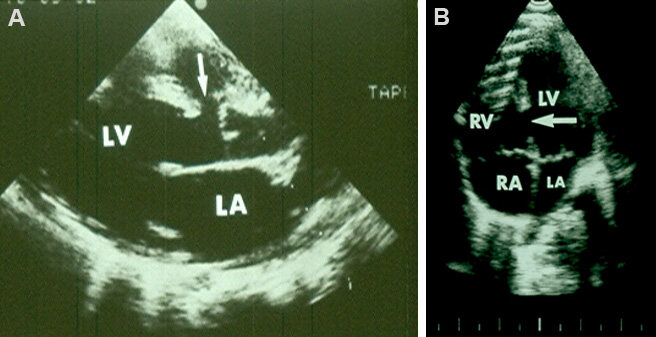
Figure 40. (A) Two-dimensional echocardiogram in a precordial long-axis view illustrating a ventricular septal defect (VSD) (arrow). The VSD is located just below the aortic valve in the upper most part of the inter-ventricular septum. (B) Echocardiogram in apical four-chamber view presents a muscular VSD (arrow). Definitive difference in site of VSD between the right and left panels is noted. The left atrium (LA), left ventricle (LV), right atrium (RA), and right ventricle (RV) are marked. Modified from Ref.[3].
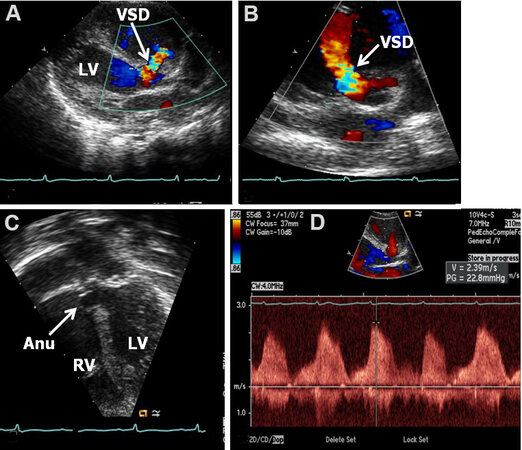
Figure 41. Echo-Doppler studies in parasternal long (A) and short (B) axis and apical four-chamber (C) projections of the ventricular septum illustrating a perimembranous ventricular septal defect (VSD) with a shunt from the left ventricle (LV) to the right ventricle (RV) by color (A, B) and continuous wave (D) Doppler. The presence of an aneurysm (Anu) in C is suggestive of progression to spontaneous closure. A Doppler flow velocity in excess of 2 m/s (D) suggests that the VSD is restrictive. Reproduced from Ref.[16].
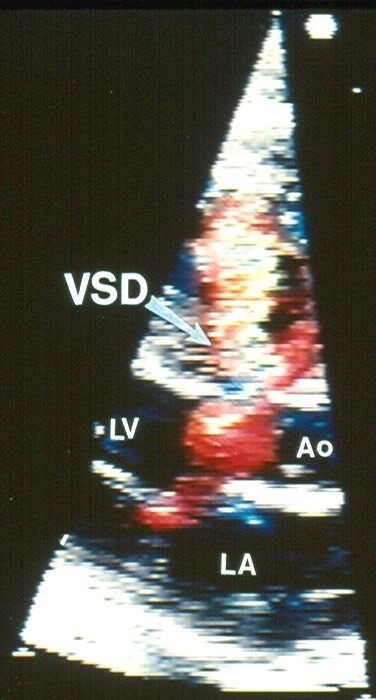
Figure 42. Echocardiographic study with color flow Doppler in a parasternal long-axis view illustrating a perimembranous ventricular septal defect (VSD) with left-to-right shunt. Note turbulent flow across the VSD. Aorta (Ao), left atrium (LA), and left ventricle (LV) are labeled. Modified from Ref.[3].
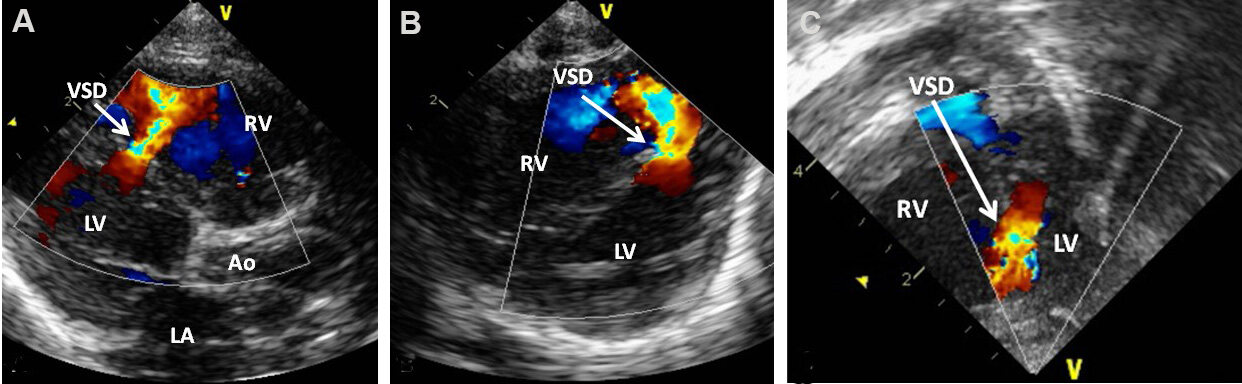
Figure 43. Echo-Doppler studies in parasternal long (A) and short (B) axis and apical four-chamber (C) projections of the ventricular septum demonstrating a small to moderate mid-muscular ventricular septal defect (VSD) with shunt from the left (LV) to the right (RV) ventricle by color flow Doppler. Aorta (Ao) and left atrium (LA) are marked. Reproduced from Ref.[15].
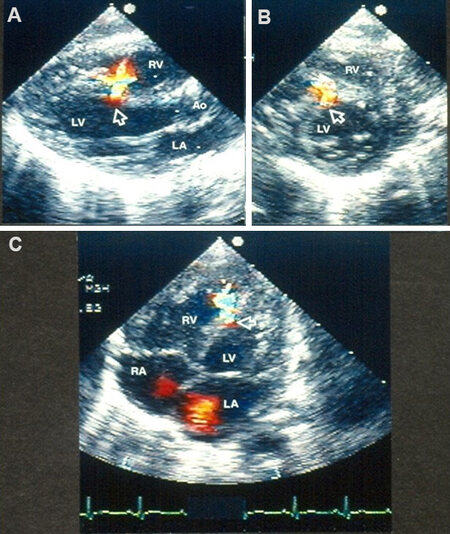
Figure 44. Echo-Doppler studies in parasternal long (A) and short (B) axis and apical four-chamber (C) projections of the ventricular septum demonstrating a small mid-muscular ventricular septal defect (VSD) (arrows in A, B, and C) with shunt from the left (LV) to the right (RV) ventricle by color flow Doppler. Definitive difference in the site of the VSD between this and the perimembranous VSD illustrated in [Figure 40A, Figure 41A and B, Figure 42] should be noted. Aorta (Ao), left atrium (LA), and right atrium (RA) are marked. Reproduced from Ref.[3].
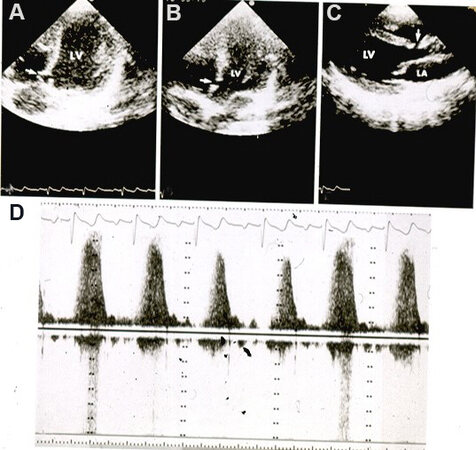
Figure 45. Echo-Doppler studies in apical four-chamber (A, B) and parasternal long-axis (C) projections demonstrating a very small ventricular septal defect (VSD) (arrows in A-C) with increased flow velocity through the VSD by continuous wave Doppler (D). Note partial occlusion of the VSD (A) due to aneurismal formation. The left atrium (LA) and left ventricle (LV) are labeled. Reproduced from Ref.[34].
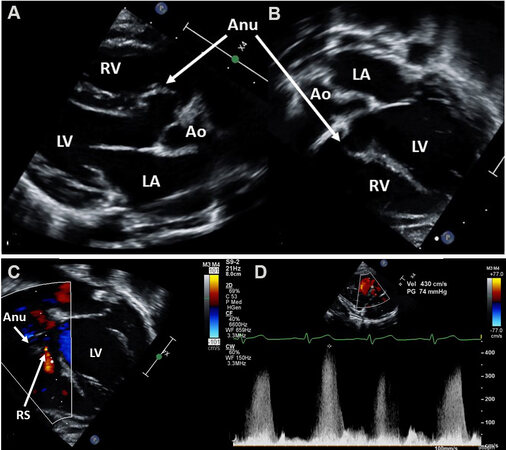
Figure 46. Echo-Doppler studies in parasternal long-axis (A, D) and apical four-chamber (B, C) views of a ventricular septal defect in the process of spontaneous closure. Note the aneurism (Anu) seen by two-dimensional echo (A-C). Tiny residual shunt (RS) is seen by color flow imaging (C). There is high Doppler velocity (4.3 m/s) by continuous wave Doppler (D) suggesting that the residual defect is small. Ao: Aorta; LA: left atrium; LV: left ventricle; RV: right ventricle.
Five chamber apical and subcostal echocardiographic views should be scrutinized to document/exclude aortic valve prolapse. The site of VSD, membranous [Figure 40A, Figure 41A and B], muscular [Figures 43 and 44], supracrystal or AV septal (see AVSD section below) can also be demonstrated by the echocardiographic studies. The magnitude of peak Doppler flow velocity across the ventricular defect is inversely related to the dimension of the VSD. As reviewed in the section on “Methods of Estimation of Pulmonary Artery Pressure” of Part I of this series, the peak Doppler flow velocity across the VSD may be used in the estimation of RV/PA systolic pressures. An example of a very small VSD with increased Doppler flow velocity via the VSD is illustrated in [Figure 45].
Echocardiography is also useful in demonstrating the effectiveness of surgical closure and device occlusion and in detecting residual shunts.
Patent ductus arteriosus
During fetal life, the de-saturated blood from the RV and PA is diverted via the ductus arteriosus (DA) into the DAo and from there, via the umbilical arteries into the placenta for picking up oxygen and for exchange of waste products of excretion[21-23]. Following birth, spontaneous narrowing of the DA takes place; such ductal constriction is presumed to be due to elevated PO2[21-23]. However, spontaneous closure of the ductus does not happen in some babies. Patency of the DA may be seen as a sole defect, or it may occur along with other CHDs. Simple PDAs comprise 6% to 11% of all CHDs. The prevalence of PDA is higher in premature infants; the earlier the gestational age, the greater the prevalence. Issues related to PDAs associated with other CHDs will not be included in this review.
The open ductus is a muscular conduit connecting the main PA with the DAo. Its configuration is variable; conical or funnel shaped PDAs are more frequently seen. Such PDAs have a wider aortic end (ampulla) which progressively becomes narrow as it enters the PA. The narrowest portion is frequently located at its junction with the PA. Other varieties and shapes are also seen.
Echocardiogram reveals differing levels of LA and LV dilatation, largely proportional to minimal ductal diameter. The LV contractility is usually within in normal range; becomes hyper-contractile with time, and eventually worsens with large, persistent ductal shunts. Doppler interrogation demonstrates a typical diastolic flow pattern in the PA [Figure 47], suggestive of PDA. Color Doppler imaging clearly demonstrates the PDA [Figures 48 and 49].
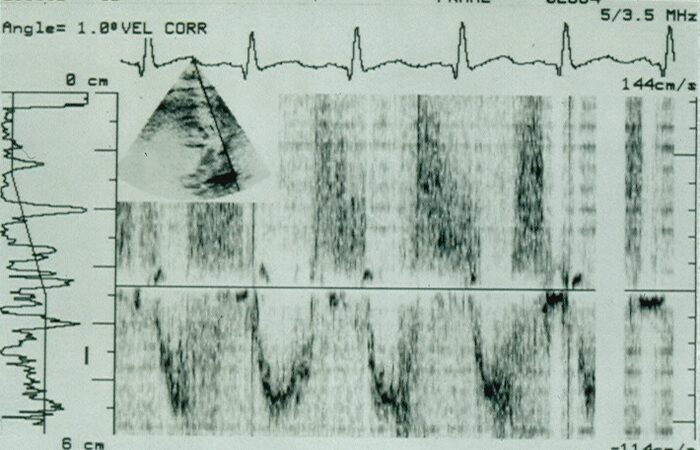
Figure 47. Selected video frame from parasternal short-axis view recording of flow velocity in the main pulmonary artery (PA) (insert) by pulsed Doppler. Normal PA flow is shown as a negative deflection during systole phase, while the diastolic flow of patent ductus arteriosus is represented by positive signal. Reproduced from Ref.[35].
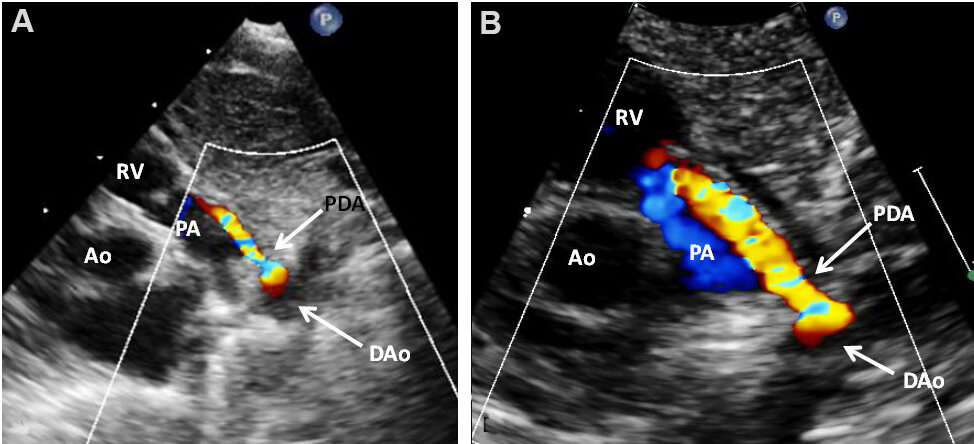
Figure 48. (A) Echo-Doppler study in a modified high parasternal short-axis (ductal) projection, illustrating a small patent ductus arteriosus (PDA) with shunting from descending aorta (DAo) to the pulmonary artery (PA) by color Doppler. (B) Magnified view of (A). Aorta (Ao) and right ventricle (RV) are labeled.
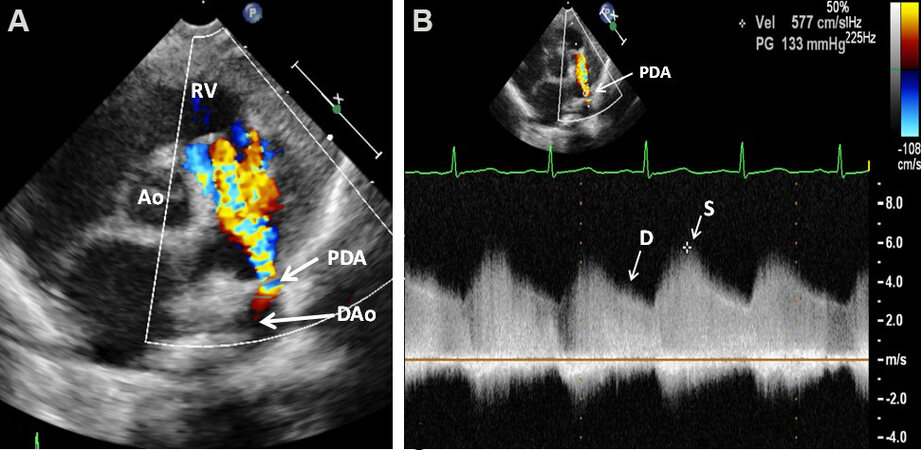
Figure 49. Selected video frames from parasternal short-axis 2D and color flow recording (A) showing a patent ductus arteriosus (PDA) shunting left-to-right. A high Doppler flow velocity (B) via the PDA (≈ 4 m/s) suggests that the PDA is small and the pressure in the pulmonary artery is low. Aorta (Ao), diastolic (D), descending aorta (DAo), right ventricle (RV), and systolic (S) are labeled. Reproduced from Ref.[16].
While the clinical diagnosis of PDA with echocardiographic confirmation is relatively simple in infants, children, adolescents, and adults (since the indication for PDA closure is straight forward), it is more problematic in identifying hemodynamically significant PDAs (hsPDAs) in premature infants. The hsPDAs can be clearly identified and quantified by echocardiographic examination[36-38]. The left atrial diameter
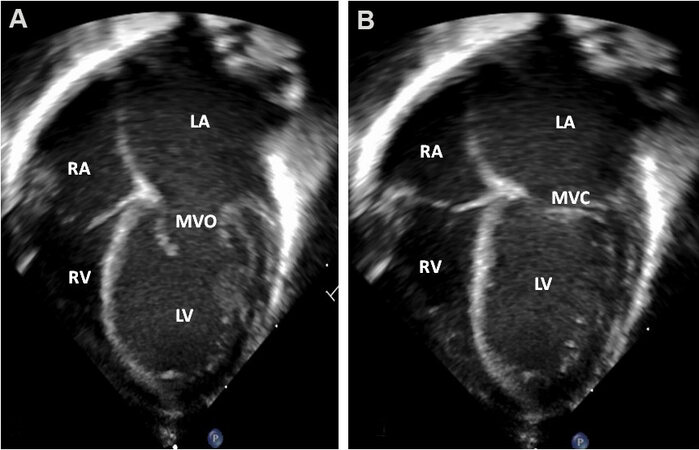
Figure 50. Echo images from apical four-chamber projections illustrating a dilated left atrium (LA) and left ventricle (LV). The images are recorded with open (MVO) and closed (MVC) mitral valve leaflets respectively, depicted in (A) and (B). However, this appearance of dilated LA and LV is very subjective. The right atrium (RA) and right ventricle (RV) are marked. Reproduced from Ref.[36].
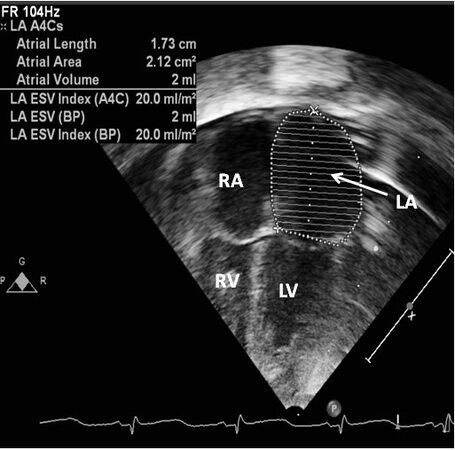
Figure 51. Echo images from an apical four-chamber projection illustrating plotting of the area of the left atrium (LA). While the area measurements can be made (see insert at the top left of the image), normal values for several premature baby groups have not been established. The left ventricle (LV), right atrium (RA), and right ventricle (RV) are labeled. Reproduced from Ref.[36].
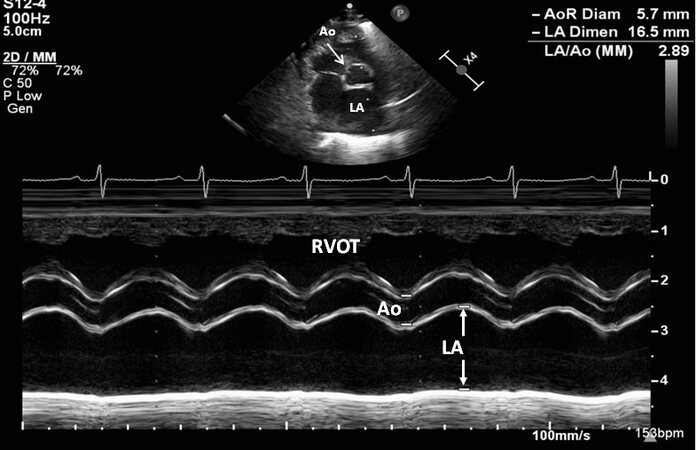
Figure 52. Echocardiographic recording in a parasternal short-axis view by M-mode illustrating how to measure the diameters of the left atrium (LA) and aorta (Ao). Increased LA/Ao ratio is observed. The right ventricular outflow tract (RVOT) is labeled. Reproduced from Ref.[36].
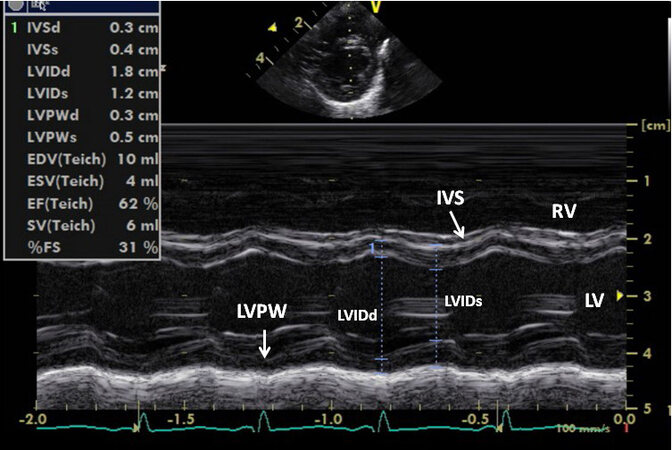
Figure 53. Echo recording in parasternal short-axis projection showing the left ventricular (LV) internal dimensions in end-diastole (LVIDd) and systole (LVIDs). These dimensions may be used to compute fractional shortening (%FS), along with other data shown in the insert. Inter-ventricular septum (IVS), left ventricular posterior wall (LVPW), and right ventricle (RV) are also labeled. Reproduced from Ref.[36].
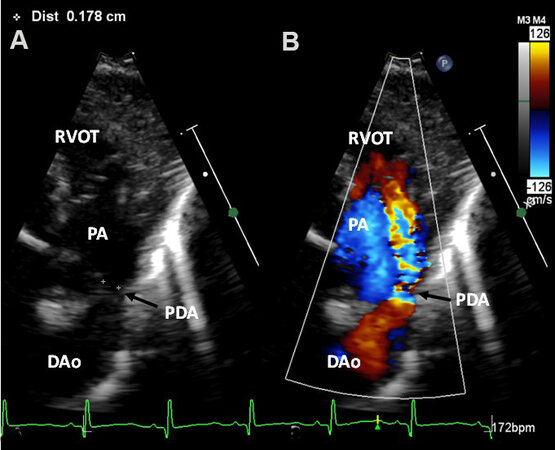
Figure 54. Echo-Doppler study in the parasternal short-axis projection illustrating how to measure the minimal ductal diameter. The color flow signal of the patent ductus arteriosus (PDA) as shown in (B) is removed and the 2-dimensional (2D) minimal diameter is measured in (A). Descending aorta (DAo), pulmonary artery (PA), and right ventricular outflow tract (RVOT) are labeled. Reproduced from Ref.[36].
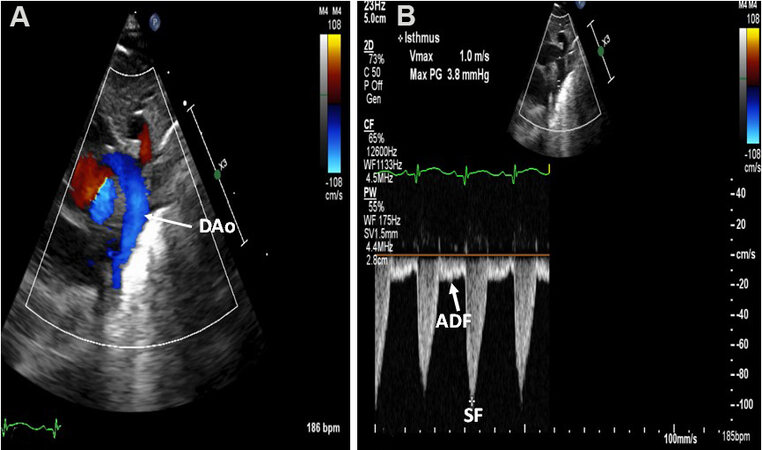
Figure 55. (A) Echo-Doppler studies from a suprasternal notch projection demonstrating laminar flow pattern in the descending aorta (DAo) in a premature baby with a small patent ductus arteriosus (not shown). (B) A continuous wave Doppler trace displays typical systolic flow (SF) (*) and normal anterograde flow in diastole (ADF) in the DAo. Note that the diastolic flow is visualized below the reference line. Reproduced from Ref.[36].
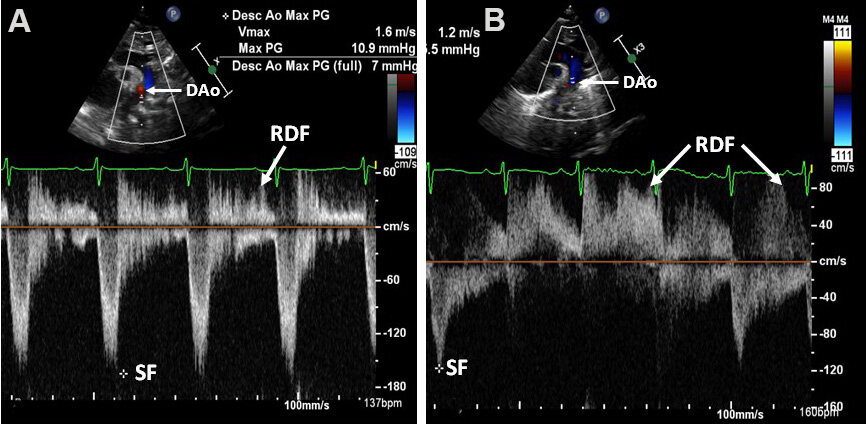
Figure 56. Selected video frames in a suprasternal notch projection illustrating retrograde diastolic flow (RDF) in the descending aorta (DAo) in two separate premature infants (A, B), each having a large patent ductus arteriosus (PDA). These babies are expected to have hemodynamically significant PDAs. The low magnitude systolic flow (SF) (*) indicates no sign of descending aortic narrowing. Reproduced from Ref.[36].
Examples of small, medium, and large PDAs are shown in [Figures 56-58].
With small PDAs, the diameters of the LA and LV and the LA:Ao ratio (< 1.4:1) are normal. The LV systolic function is also normal. With large PDAs the LA and LV are enlarged and the LA:Ao ratio is greater than 1.6:1. At first, the LV shortening fraction is within normal limits or increased (hyper-dynamic). Gradually, the LV function indices worsen, which results in elevated end-diastolic LV and LA pressures. This can lead to deterioration of pulmonary function. In moderate-sized PDAs, the data may be in between, with moderate enlargement of the LV and LA with a LA:Ao ratio between 1.4 to 1.6. The majority of babies have normal LV systolic function. In babies with small PDAs, the minimal PDA size is small and the Doppler flow velocity through the PDA is high [Figure 57]. In infants with large PDAs, the minimal PDA width is big and Doppler flow velocity through the ductus is low [Figure 59]. In moderate-sized PDAs, these values are in the middle [Figure 58]. With small ductus’s the pressures in the PA are generally within the normal range, while the pressures in PA are high in babies with large ductus. Whereas the preceding assertions are largely correct, the PA pressure is also influenced by the extent of lung parenchymal abnormality. Additionally, in very low birth weight babies, the PA pressures might not be elevated in proportion to the lung parenchymal disease secondary to under-developed pulmonary blood vessels in premature infants. Lastly, the anterograde DAo diastolic flow is normal in babies with small ductus [Figure 54] whilst with large PDAs there is either retrograde flow in diastole in the descending aorta [Figure 55], or usual anterograde DAo diastolic flow is not observed. In babies with medium and large PDAs in association with compromised respiratory status, a diagnosis of hsPDA may be established[36-38].
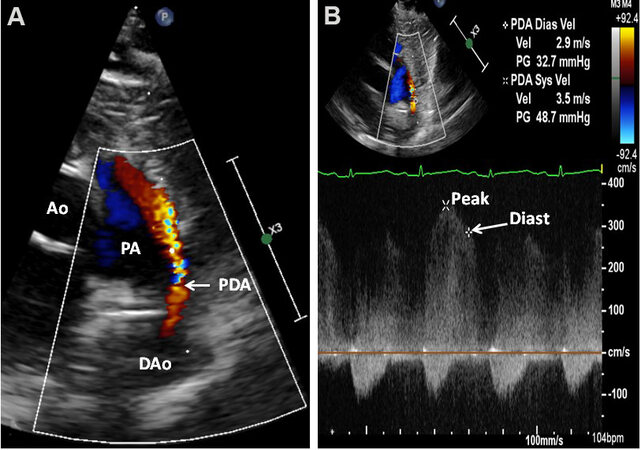
Figure 57. Echocardiographic study in parasternal short-axis projections featuring a small patent ductus arteriosus (PDA) (arrow in A) with a shunt from the descending aorta (DAo) to the pulmonary artery (PA). High Doppler flow velocity through the PDA by continuous wave Doppler sampling (B) indicates a low PA pressure. The Doppler flow velocity in diastole (Diast) (arrow) of 2.9 m/s may be utilized to compute the PA diastolic pressure (see the text in Part I for additional discussion). Reproduced from Ref.[36]. Ao: Aorta; P: peak velocity.
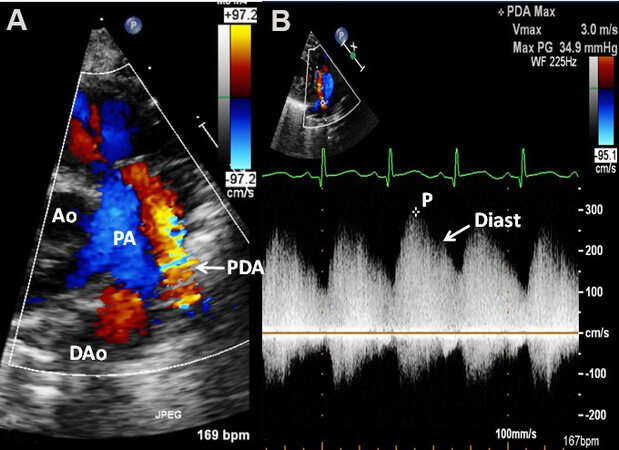
Figure 58. Echocardiographic study in parasternal short-axis projections (similar to [Figure 57], but from a different premature infant) featuring a moderate patent ductus arteriosus (PDA) (arrow in A) with a shunt from the descending aorta (DAo) to the pulmonary artery (PA). Doppler flow velocity through the PDA by continuous wave Doppler sampling (B) indicates a higher PA pressure than in the baby illustrated in [Figure 57]. Aorta (Ao) and peak velocity (P) are marked. Reproduced from Ref.[36].
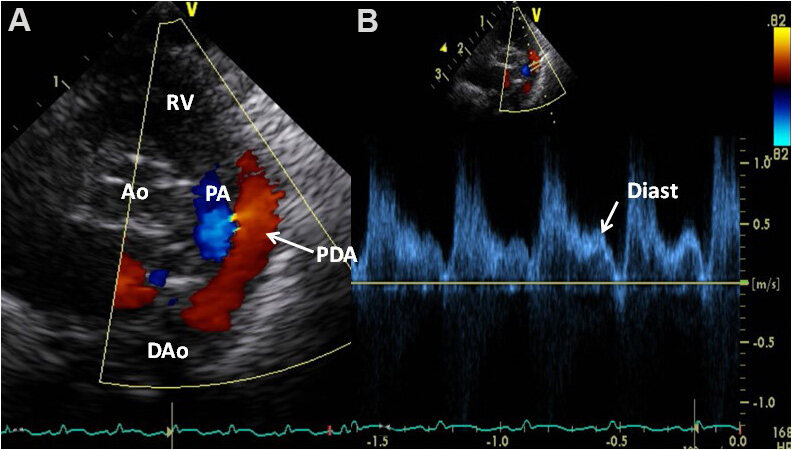
Figure 59. Echocardiographic study in parasternal short-axis projections (similar to [Figures 57 and 58], but from a different premature infant) featuring a large patent ductus arteriosus (PDA) (arrow in A) with a shunt from the descending aorta (DAo) to the pulmonary artery (PA). Doppler flow velocity through the PDA by pulsed wave Doppler sampling (B) was low (< 0.5 m/s) with laminar flow, indicating a high (near-systemic) PA pressure. Aorta (Ao), peak velocity (P), and right ventricle (RV) are marked. Reproduced from Ref.[36].
Echocardiographic examination has also been found valuable in assessing outcomes following either surgical or transcatheter [Figures 60-63] closure of PDAs. Residual shunts and obstruction of the left PA or DAo by the device components may also be illustrated by echocardiographic studies.
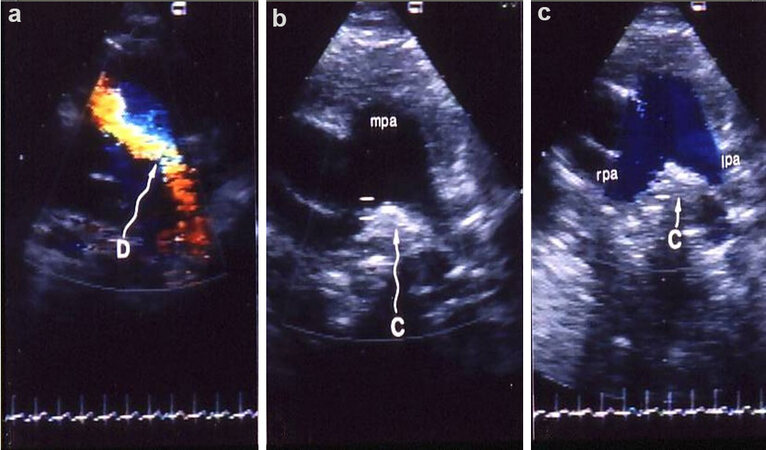
Figure 60. Echo-Doppler studies in parasternal short-axis views demonstrating the results of Gianturco coil occlusion of patent ductus arteriosus (PDA). (a) is a study performed prior to occlusion of PDA, which clearly shows the ductus (D) with left-to-right shunt. Subsequent to occlusion (b, c), the coil (C) is seen as an echo-bright structure in the angle between right (rpa) and left (lpa) pulmonary arteries (expected site of ductal ampulla). Color Doppler imaging (c) shows no evidence for residual ductus. Also note laminar (blue) flow in both rpa and lpa indicating lack of evidence of lpa obstruction. Similar study of the descending aorta (not shown) did not reveal descending aortic obstruction. mpa, main pulmonary artery. Reproduced from Ref.[39].
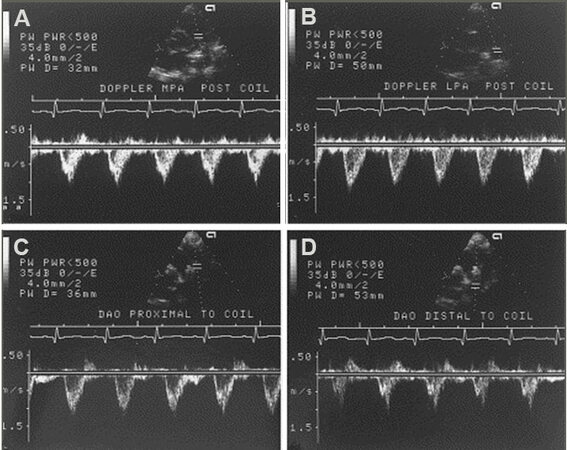
Figure 61. Doppler recordings from the main (MPA) and left (LPA) pulmonary arteries (A, B) and proximal (C) and distal (D) descending aorta (DAO) illustrating the technique of pulsed Doppler examination in an attempt to detect evidence for obstruction in the LPA and DAO. The flow velocity recordings from the LPA and distal DAO do not show increased Doppler flow velocity suggesting that there is no obstruction at these sites by the device used for occluding the patent ductus arteriosus. Continuous wave Doppler interrogation across the LPA and DAO and color flow imaging were also performed in each case (not shown). Reproduced from Ref.[40].
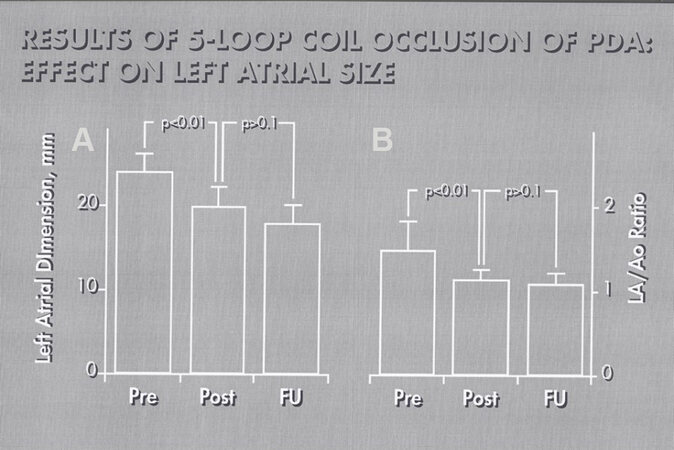
Figure 62. Bar graph illustrating a decrease (P < 0.001) in the left atrial (LA) dimension (A) and LA to aorta (LA/Ao) ratio (B) following closure patent ductus arteriosus (PDA). Values prior to (Pre), on the day after (Post) occlusion of PDA and at follow-up (FU) were shown. Note statistically significant reduction (P < 0.01) of LA size and LA:Ao ratio on the day following the procedure; these values remain unchanged (P > 0.1) at follow-up. Reproduced from Ref.[40].
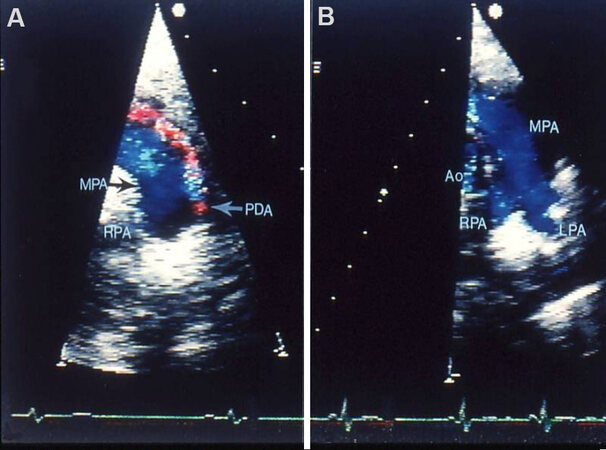
Figure 63. Echo-Doppler studies in parasternal short-axis views demonstrating the results of transcatheter buttoned device closure of patent ductus arteriosus (PDA). Panel (A) secured prior to PDA occlusion clearly demonstrates PDA (arrow in A). Panel (B) recorded following PDA closure shows no evidence for residual shunt. Note laminar (blue) flow in the main (MPA), left (LPA) and right (RPA) pulmonary arteries (B) in the study secured following PDA closure. These data clearly indicate that there is no obstruction in the LPA. Aorta (Ao) is labeled. Reproduced from Ref.[41].
Atrioventricular septal defect
Atrial and ventricular septal defects along with clefts in the mitral and/or tricuspid valves, previously named as common AV canal or complete form of endocardial cushion defect, are now commonly termed AVSDs. In the complete type, a VSD is present in the inlet portion of the ventricular septum; this VSD adjoins (contiguous with) a primum ASD. A common AV valve with a solitary valve annulus is present in the complete form. In the intermediate type, there are two separate and distinct right and left AV valves. This is considered as a variant of the complete form and has otherwise similar features as the complete variety. Partial and transitional varieties are also known to exist and are comparable to or similar to ASDs of ostium primum type (mentioned in the ASD section). These defects comprise anywhere between 4% and 5% of all congenital cardiac defects. AVSD is the most commonly seen cardiac abnormality in children with Down syndrome. The pathophysiologic abnormalities are due to shunting from the left heart to the right through the atrial and ventricular septal defects and mitral (and tricuspid) valvar regurgitation.
The echocardiogram clearly demonstrates the common AV valve, ostium primum ASD, and VSD in the inlet portion of the ventricular septum [Figures 64 and 65]. The shunting left-to-right via these defects is easily shown by Doppler interrogation (not illustrated). The AV valve anatomy [Figures 64 and 65] and the presence of AV valve insufficiency [Figure 65] may also be demonstrated on echo-Doppler studies.
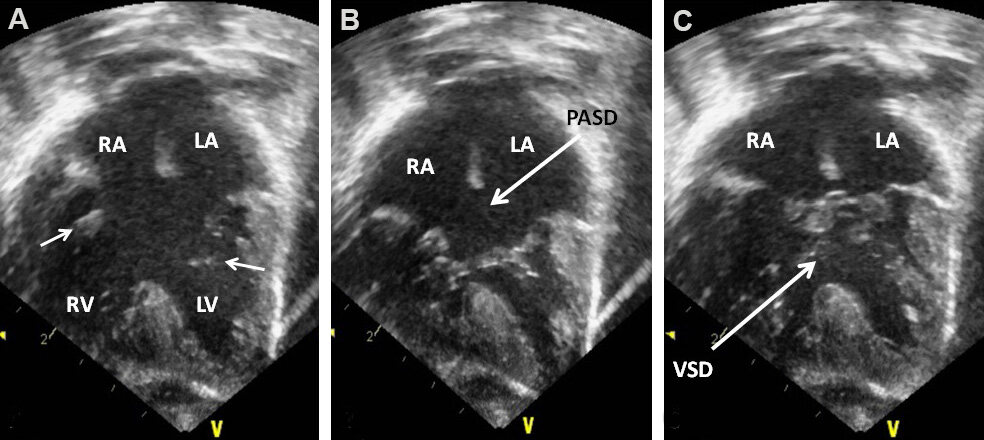
Figure 64. Echocardiographic study in apical four-chamber views of a patient with a common atrioventricular septal defect is illustrated. The atrioventricular valve is open in (A) (small arrows) while they are closed in (B) and (C). A large ostium primum atrial septal defect (PASD) and a ventricular septal defect (VSD) are demonstrated in (B, C), respectively. The left atrium (LA), left ventricle (LV), right atrium (RA), and right ventricle (RV) are labeled. Reproduced from Ref.[42].
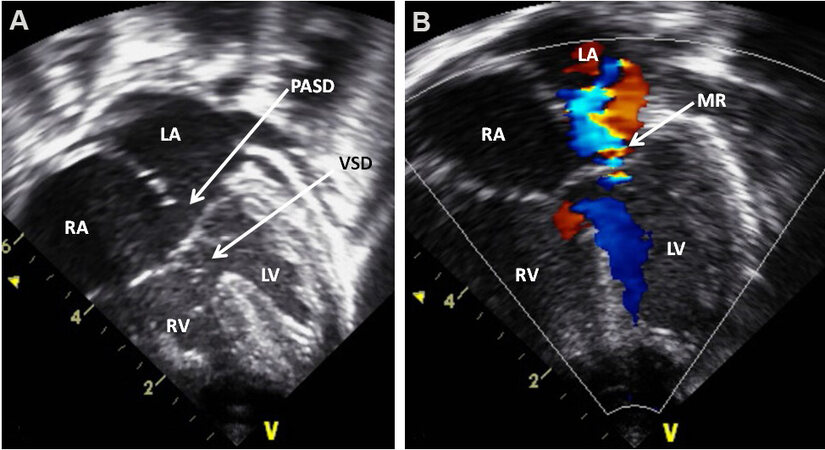
Figure 65. Echo-Doppler study in apical four-chamber views of a child with Down syndrome showing an atrioventricular septal defect. Two-dimensional imaging (A) clearly demonstrates an ostium primum atrial septal defect (PASD) and a ventricular septal defect (VSD) as pointed out by arrows in (A). Color flow Doppler illustrates mitral regurgitation (MR) as shown by an arrow in (B). Note the nearly equal sized ventricles. The left atrium (LA), left ventricle (LV), right atrium (RA), and right ventricle (RV) are labeled. Reproduced from Ref.[42].
Complete forms of AVSDs are also classified on the basis of relative sizes of the ventricles: balanced
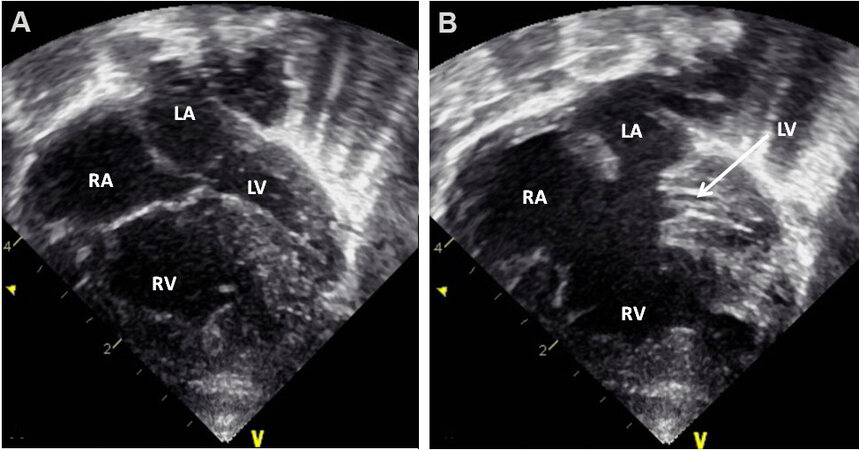
Figure 66. Selected video frames from an apical four-chamber view of a baby with a complete form of atrioventricular septal defect with severely hypoplastic left ventricle (LV). Echo images in ventricular diastole (A) and systole (B) are shown; the LV hypoplasia is more obvious in (B). The left atrium (LA), right atrium (RA), and right ventricle (RV) are labeled. Reproduced from Ref.[42].
CORONARY ARTERY ABNORMALITIES
Congenital
Congenital abnormalities of the coronary arteries (CAs) are infrequent and constitute approximately 0.1% to 2% of all CHDs. The classification of these anomalies is listed in [Table 1][43].
Classification of congenital coronary artery anomalies
| (A) Anomalous origin of the coronary artery (origin from other than the aorta)* |
| (B) Aberrant the coronary artery (origin from the aorta but from the contralateral aortic sinus of Valsalva with variation in the epicardial course)* |
| (C) Bridging (when the epicardial coronary artery dips within the myocardial layers) |
| (D) Ostial stenosis or atresia (these conditions may be isolated or may occur in association with other defects) |
| (E) Coronary arteriovenous fistula |
Echo images of normal CAs [Figures 67 and 68], aberrant origin of the left coronary artery from the right sinus of Valsalva [Figure 69], the aberrant origin of the right coronary artery from the left sinus of Valsalva
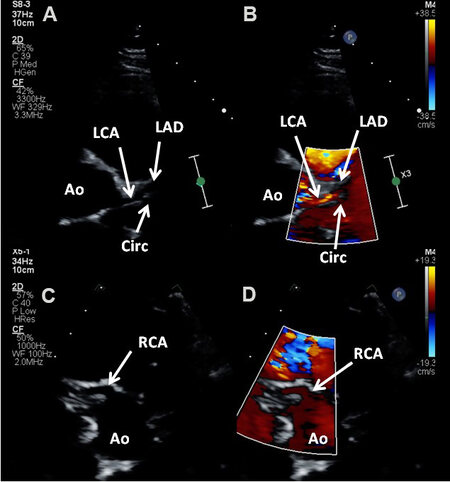
Figure 67. Echo-Doppler studies in short-axis views near the aortic sinuses demonstrating the origin and course of the left (LCA) (A, B) and right (RCA) (C, D) coronary arteries (CAs). The LCA stays the same course to become the left anterior descending artery (LAD). The circumflex (CIRC) traverses perpendicular to the axis of LCA. Color within the CAs is shown in (B) and (D) and is required to ensure that these indeed are coronary arteries and not parallel lines of the transverse sinus of the pericardium. Ao: Aorta.
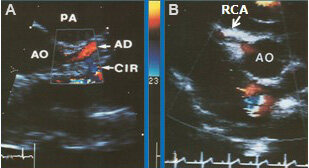
Figure 68. (A) Echo-Doppler study in short-axis view near the aortic sinuses, similar to [Figure 67], focusing on to the left coronary artery (CA) shows its division into left anterior descending (AD) and circumflex (CIR) CAs. Note the red-coded flow in the AD and the blue-coded flow in the CIR. (B) Echo-Doppler study, similar to [Figure 67A], but focusing on the right CA (RCA) showing its origin from the right sinus with color flow inside it. AO: Aorta.
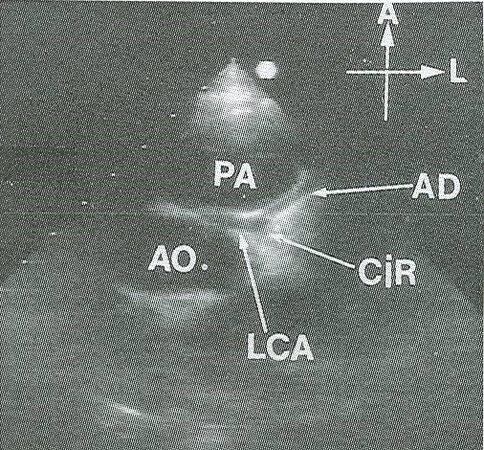
Figure 69. Echo-Doppler study in short-axis view near the aortic sinuses demonstrating the aberrant origin of the left coronary artery from the right sinus of Valsalva, traversing between the aorta (AO) and pulmonary artery (PA). Reproduced from Ref.[43].
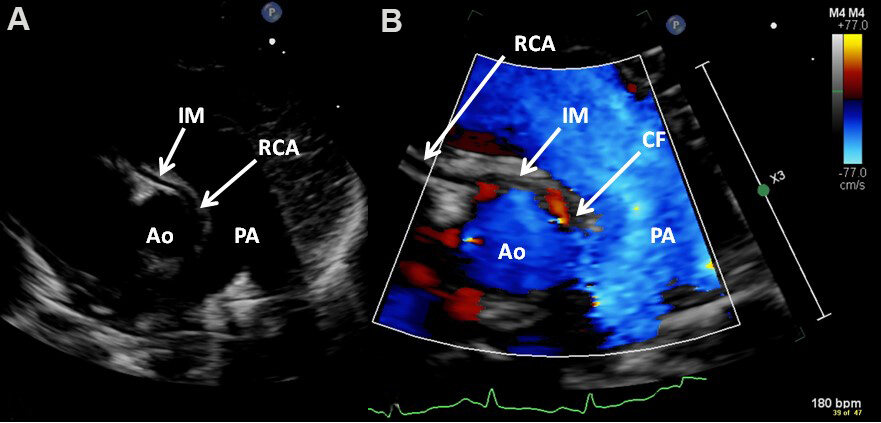
Figure 70. Echo-Doppler study in short-axis views near the aortic sinuses demonstrating aberrant right coronary artery (RCA) from the left sinus of Valsalva by two-dimensional (A) and color flow (B) imaging. Color flow (CF) at the origin of RCA (B) and intramural (IM) passage of the RCA (A, B) are shown. Ao: Aorta; PA: pulmonary artery.
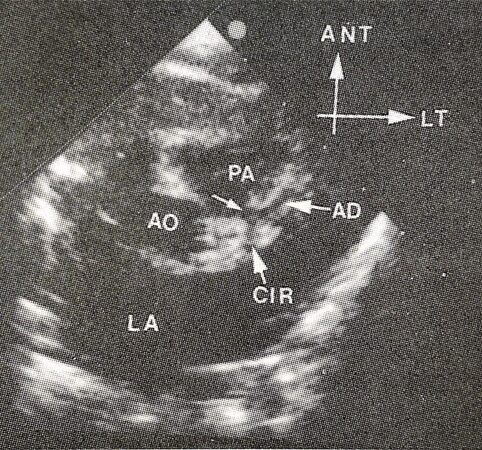
Figure 71. Echo-Doppler study in short-axis view displaying the anomalous origin of the left coronary artery (small arrow) from the posterior aspect of the pulmonary artery (PA). The division into anterior descending (AD) and circumflex (CIR) coronary arteries are also shown. Ao: Aorta; ANT: anterior; LT: left; LA: left atrium.
Other anomalies of the CAs listed in [Table 1] can also be demonstrated on echo-Doppler studies and specific attention should be paid to document these abnormalities.
Acquired
Mucocutaneous lymph node syndrome, initially published by Dr. Kawasaki[44] in 1967, is an acute systemic vascular inflammation with an inclination for the involvement of coronary arteries and the potential for the formation of aneurysms. The potential for coronary artery involvement in this syndrome increased prominence to this disease entity. Echo-Doppler examination is very useful in the assessment of these patients, both at presentation and during follow-up[45]. Both aneurysms of coronary arteries and vessel dilatation (ectasia) [Figure 72] can be illustrated by echo[45].
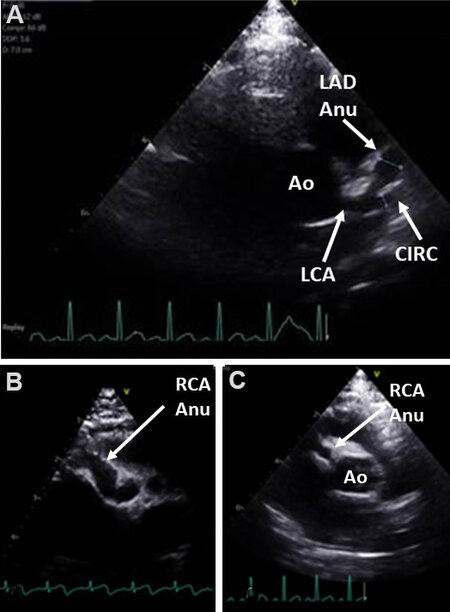
Figure 72. (A) Echocardiographic studies in short-axis view at the level of aortic sinuses illustrating dilated left main (LCA), circumflex (CIRC) and aneurysmal dilatation (Anu) of the left anterior descending (LAD) coronary arteries (CAs). (B) Diffuse aneurysmal dilatation of the right CA (RCA Anu). (C) Small aneurysm of the RCA. Ao: Aorta.
Coronary artery ectasia is deemed to exist if the coronary artery diameter measures larger than 3 mm in patients younger than 5 years of age or larger than 4 mm in patients older than 5 years of age[46]. Alternatively, if the coronary artery measures larger than 1.5 times the adjacent vessel[46] or if the Z scores are ≥ +2.5[46-49], the coronary arteries are considered dilated. CA aneurysms are characterized as small if the diameter is less than 5 mm, medium if the diameter varies from 5 to 8 mm, or large if they are larger than 8 mm in diameter. These aneurysms can easily be demonstrated in echo studies [Figure 72]. Coronary artery involvement associated with multi-system inflammatory syndrome in children (MISC-C) with COVID-19 disease can also be illustrated by echocardiographic studies.
Echocardiographic studies are also useful in detecting supplemental echocardiographic criteria [Table 2] in the absence of aneurysms or ectasia[45-48].
Supplemental echocardiographic criteria
| 1. Perivascular brightness 2. Z-scores of left anterior descending or right coronary arteries between 2 and 2.5 3. Lack of vessel tapering 4. Decreased left ventricular function 5. Mitral regurgitation 6. Pericardial effusion |
Thus, echocardiography is a useful technique in evaluating patients with Kawasaki syndrome both during the initial diagnosis and at follow-up evaluation.
SUMMARY AND CONCLUSIONS
In this review, the echo-Doppler findings of more frequently seen acyanotic CHDs were discussed. Initially, defects producing obstruction in the cardiovascular system such as aortic stenosis, aortic coarctation, pulmonary stenosis were reviewed. First, a brief presentation of anatomic features and pathophysiological abnormalities was made, followed by echocardiographic findings. Then, left-to-right shunt lesions, namely ASD, VSD, PDA, and AVSD were discussed. Also presented was a review of PDA in premature infants. Finally, a review of both congenital and acquired coronary artery anomalies was presented. The echo-Doppler findings are sufficiently characteristic to diagnose the condition, define the pathophysiology, and assess the need for surgical or transcatheter intervention such that studies such as magnetic resonance imaging, computed tomography or cardiac catheterization with selective cineangiography are rarely needed.
DECLARATIONS
AcknowledgmentsA number of echocardiographic pictures have been used as figures in this paper; these echocardiograms were secured at multiple academic institutions, including the current institution (the Children’s Memorial Hermann Hospital, Houston, Texas), that the author was privileged to work. I sincerely thank the sonographers at these institutions for their diligence in securing high-quality images. I also thank Dr. Monesha Gupta for providing base snapshots from which figures 38 and 72 were created.
Authors’ contributionsThe author contributed solely to the article.
Availability of data and materialsNot applicable.
Financial support and sponsorshipNone.
Conflicts of interestThe author declared that there are no conflicts of interest.
Ethical approval and consent to participateNot applicable.
Consent for publicationNot applicable.
Copyright© The Author(s) 2022.
REFERENCES
1. Rao PS. Diagnosis and management of acyanotic heart disease: Part I - obstructive lesions. Indian J Pediatr 2005;72:496-502.
3. Rao PS. Congenital heart defects - a review. In: Rao PS, editor. Congenital heart disease - selected aspects. Rijeka, Croatia: InTech; 2012. p. 3-44.
4. Rao PS. Echocardiographic evaluation of neonates with suspected heart disease. In: Rao PS, Vidyasagar D, editors. A multidisciplinary approach to perinatal cardiology, Volume 1. New Castle upon Tyne, UK: Cambridge Scholars Publishing; 2021. p. 314-408.
5. Singh GK, Marino C, Oliver D, et al. Pressure gradients in outflow stenotic lesions: A simultaneous Doppler and catheter correlative study in pediatric patients (Abstract). J Am Soc Echocardiogr 2000;13:455.
6. Singh GK, Mowers KL, Marino C, Balzer D, Rao PS. Effect of pressure recovery on pressure gradients in congenital stenotic outflow lesions in pediatric patients-clinical implications of lesion severity and geometry: a simultaneous Doppler echocardiography and cardiac catheter correlative study. J Am Soc Echocardiogr 2020;33:207-17.
7. Nguyen TQ, Bechsgaard T, Schmidt MR, et al. Transthoracic vector flow imaging in pediatric patients with Valvular stenosis - a proof of concept study. Ultrasound Int Open 2021;7:E48-54.
8. Galal O, Rao P, Al-fadley F, Wilson AD. Follow-up results of balloon aortic valvuloplasty in children with special reference to causes of late aortic insufficiency. Am Heart J 1997;133:418-27.
10. Rao PS. Coarctation of the aorta. In: Rao PS, Vidyasagar D, editors. A multidisciplinary approach to perinatal cardiology, Volume 2. New Castle upon Tyne, UK: Cambridge Scholars Publishing; 2021. p. 518-40.
11. Rao P, Carey P. Doppler ultrasound in the prediction of pressure gradients across aortic coarctation. Am Heart J 1989;118:299-307.
12. Rao PS, Galal O, Smith PA, Wilson AD. Five- to nine-year follow-up results of balloon angioplasty of native aortic coarctation in infants and children. J Am Coll Cardiol 1996;27:462-70.
13. Siblini G, Rao P, Nouri S, Ferdman B, Jureidini SB, Wilson AD. Long-term follow-up results of balloon angioplasty of postoperative aortic recoarctation. Am J Cardiol 1998;81:61-7.
15. Rao PS. Pulmonary valve disease. In: Alpert JS, Dalen JE, Rahimtoola, editors. Valvular heart disease. Philadelphia, PA: Lippincott Raven; 2000. p. 339-76.
16. Rao PS. Other acyanotic heart defects presenting in the neonate. In: Rao PS, Vidyasagar D, editors. A multidisciplinary approach to perinatal cardiology, Volume 2. New Castle upon Tyne, UK: Cambridge Scholars Publishing; 2021. p. 615-54.
17. Rao PS. Pulmonary stenosis. In: Rao PS, editor. Pediatric cardiology: how it has evolved over the last 50 years. New Castle upon Tyne, UK: Cambridge Scholars Publishing; 2020. p. 185-230.
18. Rao P. Doppler ultrasound in the prediction of transvalvar pressure gradients in patients with valvar pulmonary stenosis. Int J Cardiol 1987;15:195-203.
19. Rao PS. Balloon pulmonary valvuloplasty for isolated pulmonic stenosis. In: Rao PS, editor. Transcatheter therapy in pediatric cardiology. New York: Wiley-Liss, Inc.; 1993. p. 59-104.
20. Rao PS, Galal O, Patnana M, Buck SH, Wilson AD. Results of three to 10 year follow up of balloon dilatation of the pulmonary valve. Heart 1998;80:591-5.
22. Rao PS. Fetal and neonatal circulation. In: Kambam J, editor. Cardiac anesthesia for infants and children. St. Louis, MO: Mosby-Year Book; 1994. p. 10-9.
23. Rao PS. Perinatal circulatory physiology. In: Rao PS, Vidyasagar D, editors. A multidisciplinary approach to perinatal cardiology, Volume 1. New Castle upon Tyne, UK: Cambridge Scholars Publishing; 2021. p. 2-18.
24. Rao P. Diagnosis and management of acyanotic heart disease: part II -- left-to-right shunt lesions. Indian J Pediatr 2005;72:503-12.
25. Rao PS. Atrial septal defect: a review. In: Rao PS, editor. Atrial septal defect; Rijeka, Croatia: InTech; 2012. p. 3-20.
26. Rao P, Sideris EB, Hausdort G, et al. International experience with secundum atrial septal defect occlusion by the buttoned device. Am Heart J 1994;128:1022-35.
27. Rao P, Wilson AD, Levy JM, Gupta VK, Chopra PS. Role of “buttoned” double-disc device in the management of atrial septal defects. Am Heart J 1992;123:191-200.
28. Pedra CAC, Pedra SRF, Esteves CA, et al. Transcatheter closure of secundum atrial septal defects with complex anatomy. J Invasive Cardiol 2004;16:117-22.
29. Podnar T, Martanovic P, Gavora P, Masura J. Morphological variations of secundum-type atrial septal defects: feasibility for percutaneous closure using Amplatzer septal occluders. Catheter Cardiovasc Interv 2001;53:386-91.
30. Rao PS. Non-surgical closure of atrial septal defects in children. In: Larkin SA, editor. Atrial and ventricular septal defects: molecular determinants, impact of environmental factors and non-surgical interventions. Nova Science Publishers, Inc.; 2013.
31. Rao PS. Atrial septal defect. In: Rao PS, editor. Pediatric cardiology: how it has evolved over the last 50 years. New Castle upon Tyne, UK: Cambridge Scholars Publishing; 2020. p. 321-86.
32. Hagen PT, Scholz DG, Edwards WD. Incidence and size of patent foramen Ovale during the first 10 decades of life: an autopsy study of 965 normal hearts. Mayo Clin Proc 1984;59:17-20.
33. Rees AH, Rao PS, Rigby JJ, Miller MD. Echocardiographic estimation of left-to-right shunt in isolated ventricular septal defects. Eur J Cardiol 1978;7:25-33.
34. Rao PS. Ventricular and atrio-ventricular septal defects. In: Rao PS, editor. Pediatric cardiology: how it has evolved over the last 50 years. New Castle upon Tyne, UK: Cambridge Scholars Publishing; 2020. p. 452-85.
35. Rao PS. Doppler echocardiography in non-invasive diagnosis of heart disease in infants and children. Indian J Pediatr 1988;55:80-95.
36. Rao PS. Role of echocardiography in the evaluation of preterm infants with patent ductus arteriosus. Congenital Cardiology Today 2018;16:1-10.
37. Naidu DP, Breinholt III JP, Rao PS. Patent ductus arteriosus. In: Rajiv PK, Lakshminrusimha S, Vidyasagar D, editors. Essentials of neonatal ventilation. Elsevier; 2018. p. 1-30.
38. Rao PS. Selected aspects of patent ductus arteriosus in the premature; 0. In: Rao PS, Vidyasagar D, editors. A multidisciplinary approach to perinatal cardiology, Volume 2. New Castle upon Tyne, UK: Cambridge Scholars Publishing; 2021. p. 573-607.
39. Rao PS. Patent ductus arteriosus. In: Rao PS, editor. Pediatric cardiology: how it has evolved over the last 50 years. New Castle upon Tyne, UK: Cambridge Scholars Publishing; 2020. p. 387-451.
40. Rao P, Balfour IC, Chen S. Effectiveness of five-loop coils to occlude patent ductus arteriosus. Am J Cardiol 1997;80:1498-501.
41. Rao P, Wilson AD, Sideris EB, Chopra PS. Transcatheter closure of patent ductus arteriosus with buttoned device: first successful clinical application in a child. Am Heart J 1991;121:1799-802.
42. Rao PS. Echocardiographic evaluation of neonates with suspected heart disease. In: Rao PS, Vidyasagar D, editors. Perinatal cardiology: a multidisciplinary approach. Minneapolis, MN: Cardiotext Publishing; 2015.
43. Jureidini SB, Marino CJ, Rao PS. Congenital coronary artery abnormalities. Indian J Pediatr 1998;65:217-29.
44. Kawasaki T. Acute febrile mucocutaneous syndrome with lymphoid involvement with specific desquamation of the fingers and toes in children. Arerugi 1967;16:178-222.
45. Gupta-Malhotra M, Rao PS. Current perspectives on Kawasaki disease. Indian J Pediatr 2005;72:621-9.
46. Research Committee on Kawasaki Disease. Report of subcommittee on standardization of diagnostic criteria and reporting of coronary artery lesions in Kawasaki disease. Tokyo, Japan: Ministry of Health and Welfare; 1984.
47. Zorzi A, Colan SD, Gauvreau K, Baker AL, Sundel RP, Newburger JW. Coronary artery dimensions may be misclassified as normal in Kawasaki disease. J Pediatr 1998;133:254-8.
48. Newburger JW, Takahashi M, Gerber MA, et al. Committee on Rheumatic Fever, Endocarditis, and Kawasaki Disease, Council on Cardiovascular Disease in the Young, American Heart Association. Diagnosis, treatment, and long-term management of Kawasaki disease: a statement for health professionals from the Committee on Rheumatic Fever, Endocarditis, and Kawasaki Disease, Council on Cardiovascular Disease in the Young, American Heart Association. Pediatrics 2004;114:1708-33.
49. McCrindle BW, Rowley AH, Newburger JW, et al. American Heart Association Rheumatic Fever, Endocarditis, and Kawasaki Disease Committee of the Council on Cardiovascular Disease in the Young, Council on Cardiovascular and Stroke Nursing, Council on Cardiovascular Surgery and Anesthesia, and Council on Epidemiology and Prevention. Diagnosis, treatment, and long-term management of Kawasaki disease: a scientific statement for health professionals from the American Heart Association. Circulation 2017;135:e927-99.
Cite This Article
Export citation file: BibTeX | RIS
OAE Style
Rao PS. Echocardiography: an overview - Part II. Vessel Plus 2022;6:25. http://dx.doi.org/10.20517/2574-1209.2021.92
AMA Style
Rao PS. Echocardiography: an overview - Part II. Vessel Plus. 2022; 6: 25. http://dx.doi.org/10.20517/2574-1209.2021.92
Chicago/Turabian Style
Rao, P. Syamasundar. 2022. "Echocardiography: an overview - Part II" Vessel Plus. 6: 25. http://dx.doi.org/10.20517/2574-1209.2021.92
ACS Style
Rao, PS. Echocardiography: an overview - Part II. Vessel Plus. 2022, 6, 25. http://dx.doi.org/10.20517/2574-1209.2021.92
About This Article
Special Issue
Copyright

Data & Comments
Data


 Cite This Article 19 clicks

 Like This Article 0
likes
Like This Article 0
likes


Comments
Comments must be written in English. Spam, offensive content, impersonation, and private information will not be permitted. If any comment is reported and identified as inappropriate content by OAE staff, the comment will be removed without notice. If you have any queries or need any help, please contact us at support@oaepublish.com.