
Echocardiography: an overview - part I
 0
0
Abstract
This review describes principles of echocardiography and Doppler, outlines the techniques of echo-Doppler studies, presents methods of assessment of pressure in the pulmonary artery, reviews methodology for appraisal of ventricular function, and demonstrates the usefulness of echo in evaluating multiple neonatal issues including distressed neonate, infant of a diabetic mother, tracheo-esophageal fistula, Down syndrome, and cardiomegaly.
Keywords
INTRODUCTION
Echocardiography was introduced into the pediatric cardiac practice in the early 1970s. The addition of two-dimensional (2D) echo and Doppler techniques and other refinements have advanced the utility of the echo-Doppler studies such that these studies have replaced invasive catheterization and angiographic studies in diagnosing congenital and acquired cardiac disease in children. Carefully performed echo-Doppler studies are usually sufficient to make clinical care decisions regarding the treatment of even complex congenital cardiac defects (CCDs) with the rare need for magnetic resonance imaging, computed tomography, or cine-angiography.
The purpose of this review is to present an overview of echocardiography in pediatric practice. For a more thorough appraisal, standard text books of Pediatric Cardiology or Pediatric Echocardiography may be reviewed. In this review, the author will describe principles of echocardiography and Doppler, outline the techniques of echocardiography and Doppler studies, describe methods of estimation of pulmonary artery (PA) pressures, discuss methods used to evaluate ventricular function, and illustrate the utility of echocardiography in evaluating multiple neonatal issues. Echocardiographic findings of commonly encountered heart defects will be presented in Parts II and III of this series.
There are several specialized types of echocardiographic evaluation such as contrast echocardiography[1,2], trans-esophageal echocardiography[3-5], intra-cardiac echocardiography[6,7], intravascular ultrasound[5,8,9], fetal echocardiography[10,11], 3-dimentional echocardiography[12,13] and others; these specialized techniques will not be discussed in this review.
PRINCIPLES OF ECHO-DOPPLER - WHAT IS IT?
Ultrasound
Ultrasound is a sound beyond the perceptible (by the human ear) range, typically higher than twenty-thousand cycles/s[14-18]. The ultrasound utilized for clinical evaluation is between two and ten MHz (millions of cycles/s). The ultrasound follows the rules of reflection (echo). The ultrasound is created by “Piezoelectric” quartzes; these are either naturally available crystals or manufactured lead zirconate or barium titanate. The present transducers send out ultrasound for a tiny fraction of a second and perceive the reflected echoes for more than one thousand times longer.
Echo
When the transmitted ultrasound hits a border between two substances that have dissimilar sound resistances (acoustic impedance), the ultrasound is returned, and an echo is created. When this echo is received by the transducer, the quartz in the transducer shudders. This said shuddering is presented as a dot. The resultant dot, when documented against time on the horizontal-axis, will appear as a straight line. The “M” or motion mode echo [Figure 1] is thus produced.
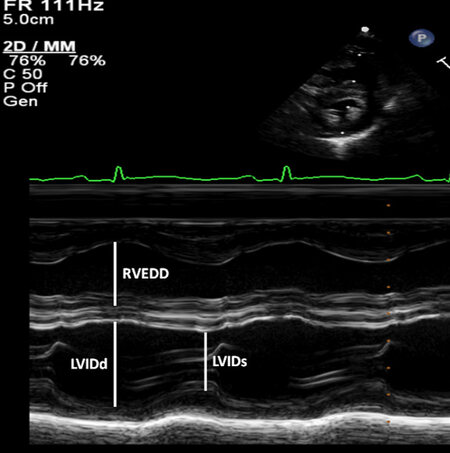
Figure 1. M-mode recording of the echo, referred to in the text, is shown in this figure. Both ventricles are shown illustrating measurements of LVIDd (left ventricular internal dimension in end-diastole) and RVEDD (right ventricular end-diastolic dimension). Both measurements are made at the start of QRS complex of the electrocardiogram (at the top) recorded simultaneously. The LVIDs (left-ventricular internal dimension in end-systole) is also shown. The measured numbers are compared with normal data and z scores are secured. This information is also utilized for determining the left ventricular global systolic function by calculating the left-ventricular shortening fraction. Reproduced from Ref.[19].
2D echo
A 2D echo is obtained in a manner similar to that of M-mode echocardiogram; however, spatial data are included with regard to the position of the echoes at the period the data are returned; this is with the aid of line locater circuitry built into the system. This 2D echo [Figure 2] is commonly utilized in the appraisal of cardiac anatomy.
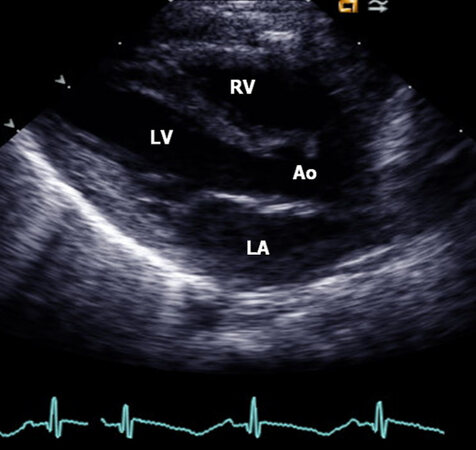
Figure 2. This figure demonstrates two-dimensional echo. Parasternal long-axis view of the cardiac structures of a normal child illustrating the left atrium (LA), left ventricle (LV), aorta (Ao), and right ventricle (RV). The mitral valve, aortic valve, and inter-ventricular septum are also shown but not labeled. Reproduced from Ref.[19].
Doppler
In the preceding paragraphs, describing imaging echoes, the targets for echo reflections are cardiac valves, myocardium, walls of the blood vessels, and additional heart anatomy. The echoes from the red (and white) blood cells are very low in strength and are disregarded. During the Doppler examination, these poor intensity echo signals from red (and white) blood cells are augmented and examined with the use of the Doppler principle, which states that an apparent shift of the transmitted frequency takes place due to the movement of the target. This frequency change of transmitted vs. returned wave fronts is examined by fast Fourier transformation, zero-crossing detector or Chirp-Z analysis, and the blood flow velocity is determined [Table 1]. The velocity data so secured is of utility in the Doppler evaluation. Several types of Doppler methods have been used to obtain the physiologic info and include pulsed wave (PW), continuous wave (CW), high pulse repetition frequency (HPRF), and color flow Doppler. All of these have a different and definitive rationale[14-19].
Summary of ultrasound, echo, and Doppler techniques
| Ultrasound | - Sound above the audible range, usually > 20,000 cycles/s - Ultrasound used for medical purposes is within 2 to 10 MHz (millions of cycles/s) - Obeys laws of reflection - Produced by “Piezoelectric” crystals |
| Echo | Reflected ultrasound. When ultrasound strikes an interface between two materials that have different acoustic impedances, it is reflected, producing an echo |
| Motion or “M” mode echo [Figure 1] | Echo recording against time on X-axis |
| Two-dimensional (2D) echo [Figure 2] | Echo recording with spatial information added with respect to the location of the beam at the time the info is received (line locater circuitry) |
| Doppler | - The low magnitude echoes from blood cells are studied - Apparent shift of transmitted frequency occurs as a result of the motion of the target - Frequency shift of transmitted to received wave fronts are analyzed by multiple methods (see the text) - Velocity is calculated: V = C × F/2 (TF) × Cosine of intercept angle, where V is velocity; C, speed of the ultrasound; F, frequency shift; TF, transmitted frequency |
| Pulsed Doppler [Figures 3 and 4] | - Uses single crystal, similar to echo - Small area along ultrasonic beam can be studied - “range gating” - Advantage: exact location of sample volume can be chosen by the examiner - Disadvantage: high-velocity flows cannot be recorded because of the low Nyquist limit of the pulsed Doppler and aliasing of the Doppler signal at high velocities |
| Continuous wave Doppler [Figure 5] | - Uses two crystals; one crystal continuously sends ultrasound and the other crystal receives reflected ultrasound (echo) - Advantage: can record high flow velocity - Disadvantage: records Doppler data along the line of the ultrasound beam and cannot be range gated |
| High pulse repetition frequency Doppler | - Similar to pulsed Doppler in that it uses a single crystal and uses pulsed ultrasound - Uses several pulses which are in the body simultaneously - Three or more sample volumes are placed along the ultrasound beam |
| Color Doppler [Figures 6 and 7] | - Multi-gated pulsed Doppler technique which superimposes color-coded Doppler flow information on a real-time 2D image; it is a 2D Doppler - Multiple sample volumes are placed along the ultrasonic beam and on many such ultrasonic beams - The velocities are color-coded so that the velocity of blood moving towards the transducer is red and blood moving away from the transducer is blue. Such assignment is conventional, but can be changed - Turbulent flow is expressed as a mosaic pattern [Figure 7] which is a mixture of yellow and green superimposed on red and blue |
PW Doppler
In PW Doppler, a solitary crystal, comparable to the standard echocardiogram is used. A tiny site along the ultrasonography beam is examined; this is named “range gating”. The site from where range gating is secured is the “sample volume”. The position and magnitude of the sample volume [Figures 3 and 4] may be changed by the examiner. This technique is commonly utilized to show normal blood flow velocity values and to locate abnormalities of flow disorder. The benefit of this method is that the precise site of the sample volume is selected by the operator, and the location of the flow abnormality can be pinpointed. However, the drawback of the pulse Doppler technique is that flow velocities of high magnitude are not recorded secondary to small Nyquist perimeter of the PW Doppler and aliasing of the Doppler at a higher velocity. Multiple techniques such as changing baseline to bottom or top, totaling the wraparound amount [Figure 5], utilizing lesser frequency transducer, decreasing the distance to the target, improving the intercept angle have been used in the past to avoid aliasing. However, at the present time, CW and HPRF Doppler techniques are being utilized to quantify velocities greater than those documented by the PW Doppler technique.
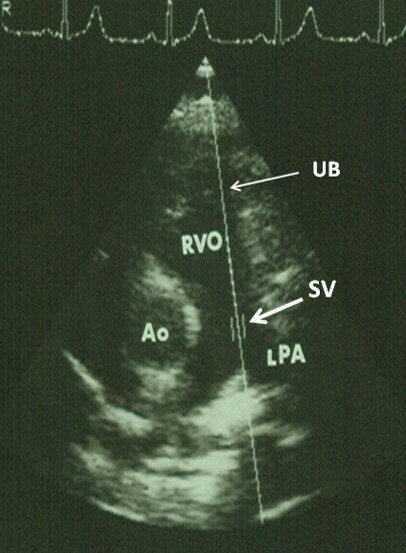
Figure 3. Echocardiogram demonstrating the location of the sample volume (SV) in the pulmonary artery (marked by thick arrow) along the ultrasound beam (UB) (marked by thin arrow). Aorta (Ao), left pulmonary artery (LPA), and right ventricular outflow tract (RVO) are labeled. Reproduced from Ref.[19].
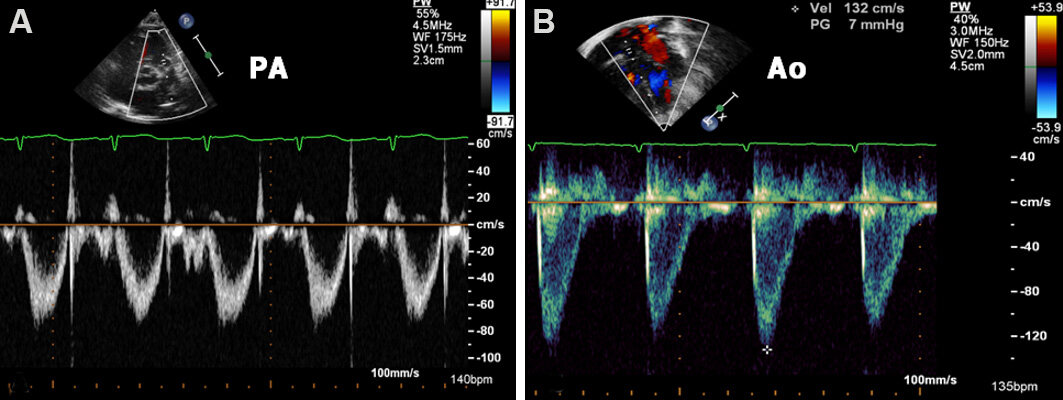
Figure 4. Echo-Doppler studies demonstrating the site of the sample volumes in the pulmonary artery (PA) (A) and the aorta (Ao) (B) in parasternal short-axis and apical five-chamber views, respectively; note that the bottom panels display pulsed Doppler recordings. Normal values are typically about 1.0 m/s. Reproduced from Ref.[19].
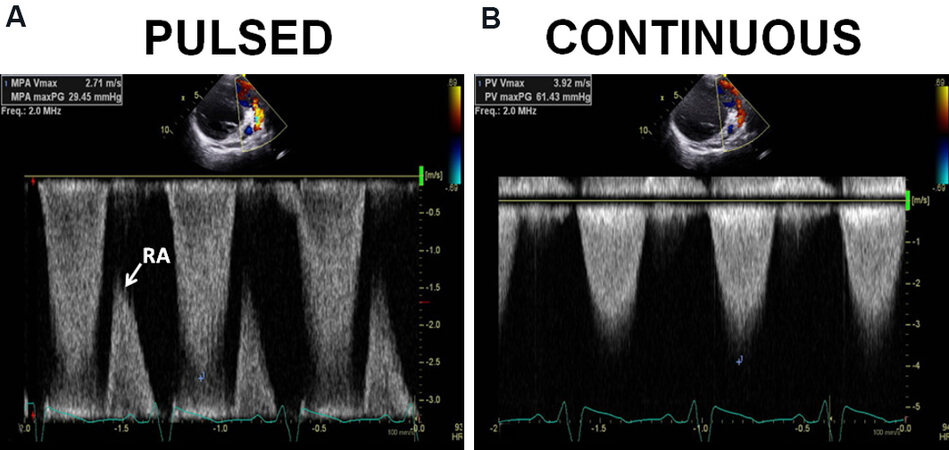
Figure 5. Echo-Doppler studies demonstrating the utility of employing both pulsed (A) and continuous wave (B) Doppler in resolving the issue of not capturing true velocity by pulsed Doppler. (A) The pulsed Doppler recording from the pulmonary artery did not capture the peak velocity. The highest velocity documented was only 2.71 m/s. However, a wrap-around (RA) was seen. (B) Continuous wave Doppler shows a peak velocity of 3.71 m/s. The failure of the pulsed Doppler to document the highest velocity is due to its reduced Nyquist limits and aliasing. Reproduced from Ref.[19].
CW Doppler and HPRF Doppler
In CW Doppler, 2 crystals are utilized, 1 crystal constantly transmits the ultrasound, and the second crystal collects the Doppler signal. The benefits of this system are that it is able to capture high flow velocity signals. However, the drawback is that this system looks at Doppler information along the beam of the ultrasound and is unable to localize the site from which the abnormal flow velocity arises. Using both PW Doppler and CW Doppler provides resolution of this problem [Figure 5]. Instead, HPRF Doppler may be used. Since the HPRF Doppler is almost completely replaced by CW Doppler, it will not be discussed further. While recording the CW Doppler velocities, the ultrasound beam needs to be either 0° or 180° along the path of the blood flow to assess the actual flow velocity. An ultrasound beam angle less than 20° may be used. A 20° angle reduces true velocity by 6%[15,16]. Any value more than 20° grossly underestimates the true velocity magnitude[15,16].
Color Doppler
During color flow imaging [Figure 6], color coding of the velocities is undertaken such that the blood flow traversing in the direction of the transducer is designated red while the flow traversing against the direction of the transducer is marked blue. The flow that is turbulent is shown with a mosaic pattern [Figure 7], consisting of a blend of blue and red superimposed upon green and yellow. During regular echo-Doppler studies, different combinations and permutations of PW, CW, and color Doppler assessment are performed.
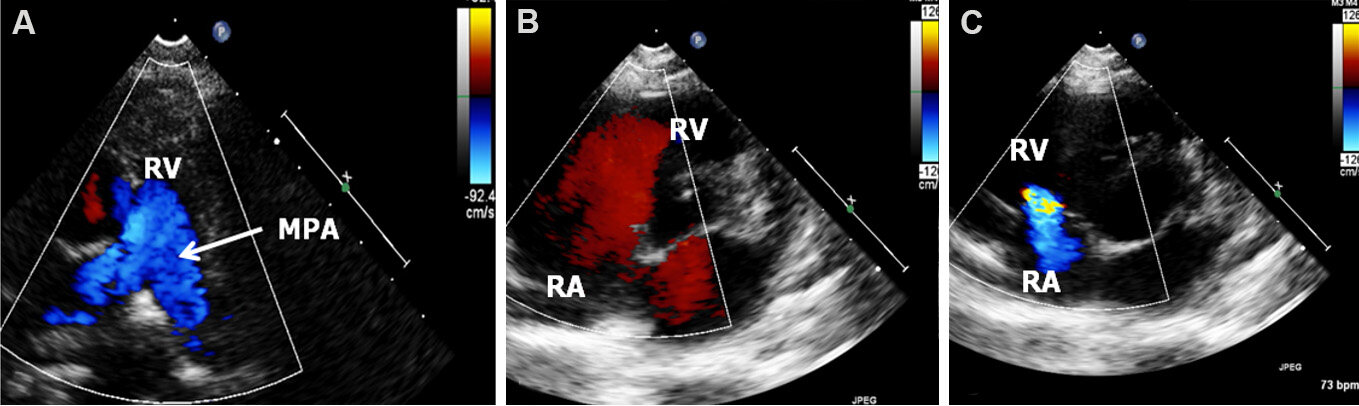
Figure 6. The composite figure shows three two-dimensional echo and color Doppler video frames to illustrate color Doppler imaging. (A) The antegrade blood flow from the right ventricle (RV) into the main pulmonary artery (MPA) is marked by blue flow (as per the inset on the right). (B) The blood flow from the right atrium (RA) to the RV is marked by red. Both these examples show the usual direction of blood flow in the heart chambers. (C) The blood flow direction is reversed secondary to tricuspid insufficiency (inset to the right). Hence, the coding by the color of the Doppler signal assists the sonographer in recognizing the direction of blood flow. It may be noted that the color flow is laminar (uniform) in frames A and B suggesting lack of any flow disturbance while some degree of turbulence is seen in frame C. Reproduced from Ref.[19].

Figure 7. Two-dimensional echo and color Doppler video frames are presented to demonstrate turbulent flow patterns. (A) Turbulent blood flow (arrow) commences at the level of the aortic valve (arrow - TF) because of aortic stenosis while (B) the turbulence begins at the ductus (TF) shown by arrow. Aorta (Ao), descending aorta (DAo), left ventricle (LV), and main pulmonary artery (MPA) are labeled. Reproduced from Ref.[19].
The Doppler information, as described in the preceding sections, is valuable in developing hemodynamic data utilizing the foregoing principles: (1) during the echo-Doppler study, careful examination to detect Doppler jets between adjacent cardiac chambers should be sought. If such Doppler jets are seen, the magnitude of the velocity (V) is assumed to be proportional to the pressure variance among the two chambers in question; (2) the pressure difference is calculated by the use of a modified Bernoulli equation (gradient = 4V²); (3) blood pressure (BP) (systolic) by arm cuff is used to estimate left ventricular (LV) peak systolic pressure subject to lack of LV outflow tract narrowing; and (4) the deductive analysis is undertaken on the basis of the preceding assumptions and data known from clinical, chest X-ray, electrocardiogram (ECG), and echo information. [Table 1] presents a synopsis of the principles of echo-Doppler procedures while [Table 2] lists normal intra-cardiac velocities by Doppler.
Normal intra-cardiac velocities by Doppler ultrasound*
| Site | Children m/s; mean (range) | Adults m/s; mean (range) |
| Mitral inflow | 1.00 (0.8-1.3) | 0.90 (0.6-1.3) |
| Tricuspid inflow | 0.60 (0.5-0.8) | 0.50 (0.3-0.7) |
| Pulmonary artery | 0.90 (0.7-1.1) | 0.75 (0.6-0.9) |
| Left ventricle | 1.00 (0.7-1.2) | 0.90 (0.7-1.1) |
| Aorta | 1.50 (1.2-1.8) | 1.35 (1.0-1.7) |
ECHO PROTOCOL
Echo-Doppler studies are carried out by placing the transducer over multiple echo windows, namely, left parasternal area, cardiac apex, subcostal region, and suprasternal area. Data from parasternal long-axis [Figure 2], parasternal short-axis [Figure 8], apical four-chamber, apical five-chamber [Figure 9], subcostal
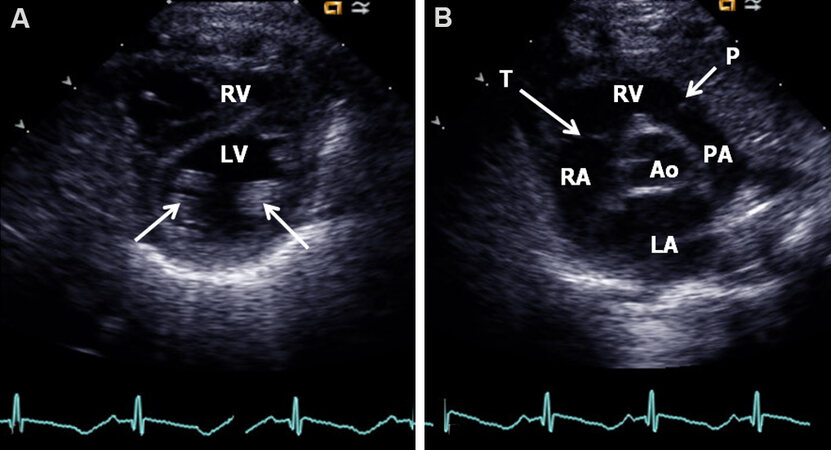
Figure 8. Echo frames from parasternal short-axis view of the heart at the level of papillary muscles (arrows) (A) and at the level of the aortic valve (B). (A) The left ventricle (LV) is visualized posteriorly and the right ventricle (RV) is seen anteriorly. (B) The aorta (Ao) is in the middle with the left atrium (LA) behind it and the RV in front of it. P: Pulmonary valve; PA: pulmonary artery; RA: right atrium; T: tricuspid valve. Reproduced from Ref.[19].
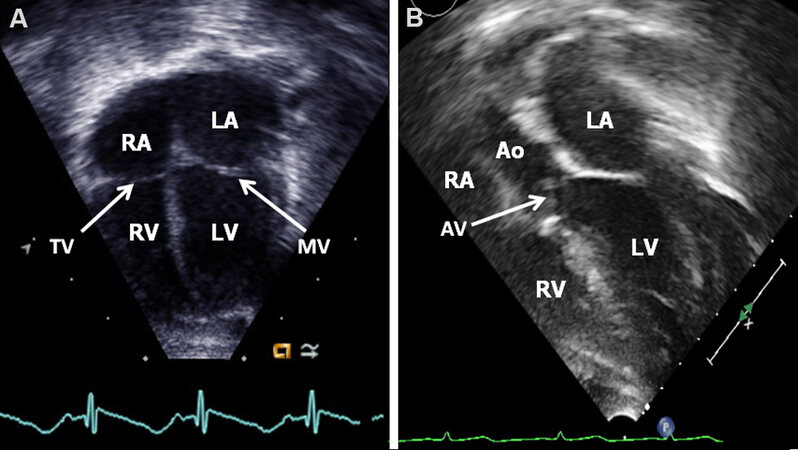
Figure 9. Echo frames from apical four-chamber (A) and apical five-chamber (B) views of the heart demonstrating the left atrium (LA), left ventricle (LV), right atrium (RA), and right ventricle (RV), mitral valve (MV) and tricuspid valve (TV) (arrows) in (A) and in addition, LV outflow tract, aortic valve (AV, arrow), and aorta (Ao) in (B). Atrial and ventricular septae (not marked) are also shown. Reproduced from Ref.[19].
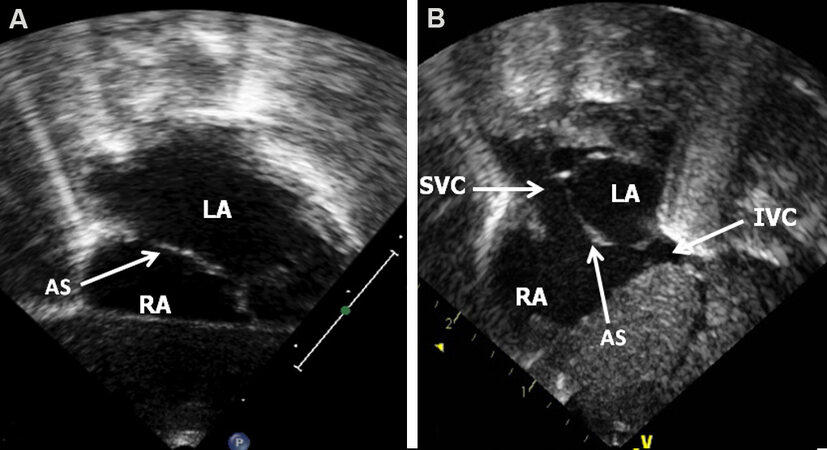
Figure 10. Echo frames from subcostal long-axis (A) and short-axis (B) views illustrating the anatomy of the atrial septum (AS) (arrow) in (A). Reproduced from Ref[19]. IVC: Inferior vena cava; LA: left atrium; RA: right atrium; SVC: superior vena cava.
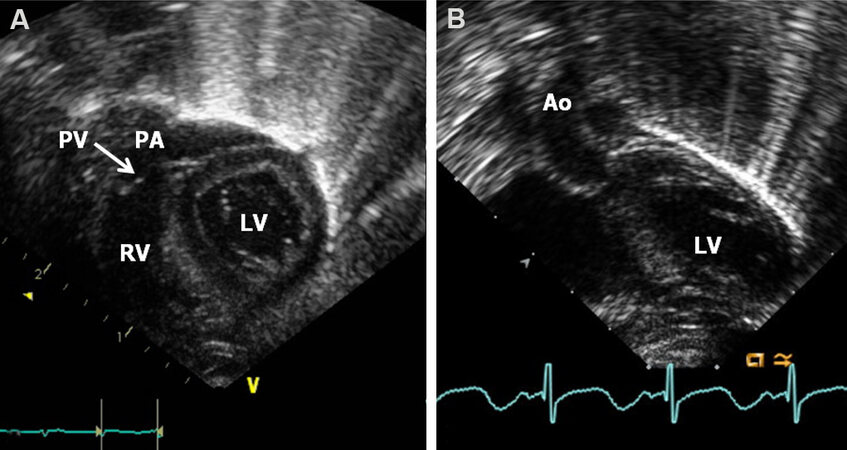
Figure 11. Echo frames from subcostal long-axis views of the ventricles illustrating the positions of the right ventricle (RV), pulmonary valve (PV), and pulmonary artery (PA) in (A) and of the left ventricle (LV) (seen posteriorly) and aorta (Ao) in (B). Reproduced from Ref.[19].
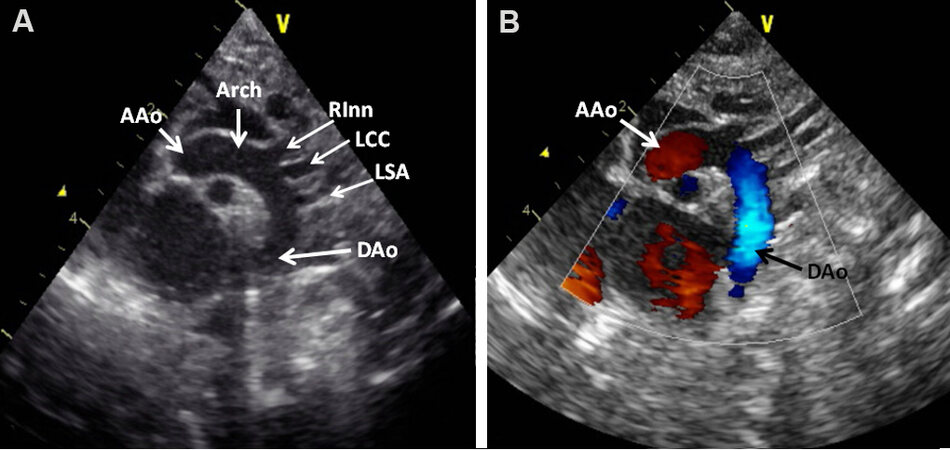
Figure 12. Echo frames from suprasternal notch view of the aortic arch (Arch) illustrating the ascending aorta (AAo), aortic arch, and descending aorta (DAo) in two-dimensional (A) and with color flow (B) imaging. The right innominate (RInn), left common carotid (LCC), and left subclavian (LSA) arteries originating from the aortic arch are demonstrated without in (A) and with color in (B) flow imaging. Note red flow in the AAo and blue flow in the DAo (B). Reproduced from Ref.[19].
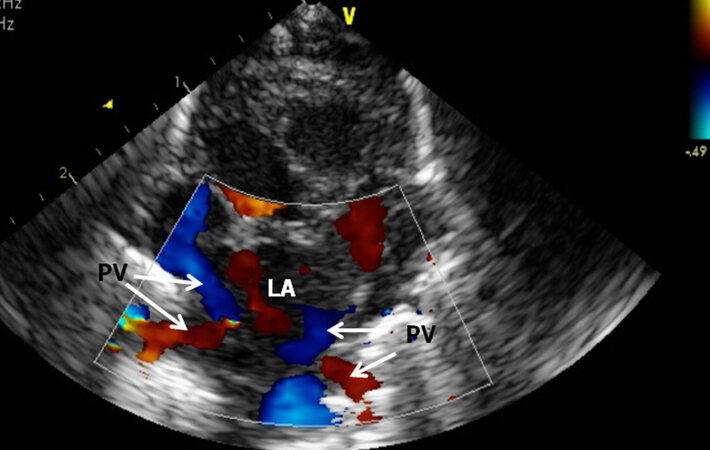
Figure 13. Echo frame from suprasternal notch crab-view of the left atrium (LA) demonstrating the entry of pulmonary veins (PV) into the LA. During routine studies, all the PVs are pulse Doppler interrogated to document normal Doppler velocity (not shown). Reproduced from Ref.[19].
M-mode and 2D recordings along with PW, CW, color flow Doppler assessment, as deemed suitable, are carried out methodically. Examination by Doppler should include (1) search for shunts across the atrial and ventricular septae; (2) exclude atrio-ventricular (AV) valve insufficiency by interrogation of the left and right atria proximal to the mitral and tricuspid valves, respectively; (3) explore the left/right ventricular inflow sites to exclude mitral/tricuspid stenosis; (4) examine the left and right ventricular outflow tracts to detect aortic and pulmonary valve insufficiency, respectively; (5) interrogate the pulmonary artery and aorta for semilunar valve stenosis; and (6) examination looking for aortic coarctation and patency of the ductus arteriosus. Investigation of additional sites on the basis of findings of clinical, laboratory and echocardiographic examination should be performed as well.
METHODS OF ESTIMATION OF PULMONARY ARTERY PRESSURE
Frequently, neonatologists, pediatric cardiologists, pediatric intensivists, cardiac surgeons and pediatricians request for evaluation of PA pressures in their patients. Although the reasons for such request vary from one specialist to the other, the magnitude of the PA pressure is a central component in managing many such patients. While PA pressure may be secured by right heart catheterization, such a procedure is invasive and is rarely performed for the sole purpose of PA pressure measurement. Echo-Doppler is a non-invasive method by which the PA pressure can be assessed with relative ease. Previously, a number of techniques such as the pattern of pulmonary valve motion on M-mode echo, ratio of the pre-ejection period (PEP) to right ventricular ejection time, pattern of Doppler PA flow velocity curve, and pulsatility index of PA were utilized in the estimation of PA pressures. However, in general, these methods are not reliable[19]. If Doppler jets can be documented across the right heart structures, such Doppler jet velocities (V) are utilized in the calculation of the pressure variance among the two chambers in question by applying a simplified Bernoulli formula: Gradient = 4V2. In addition, measurement of systolic BP in the arm simultaneous with echo is helpful to quantify the magnitude of increase in the pulmonary pressures. In Table 3, the author enumerates different formulas that are used during the calculation.
Calculations/formulas used in the text
| Modified Bernoulli equation | Gradient = 4V2 Where V is Doppler jet velocity |
| Estimation of the pulmonary artery systolic pressure in the presence of tricuspid insufficiency | PAP = RVP = 4V2 + 5 mmHg Where PAP is pulmonary artery systolic pressure, RVP is right ventricular systolic pressure, and V is regurgitant tricuspid jet velocity. The right atrial pressure is assumed to be 5 mmHg |
| Estimation of the pulmonary artery systolic pressure in the presence of a ventricular septal defect (VSD) | PAP = RVP = LVP - 4V2 Where PAP is pulmonary artery systolic pressure, RVP is right ventricular systolic pressure, LVP is left ventricular peak systolic pressure (systolic blood pressure) and V is VSD jet velocity magnitude |
| Estimation of the pulmonary artery diastolic pressure in the presence of pulmonary insufficiency | PA diastolic pressure = 4V2 + 5 Where PA is pulmonary artery and V is pulmonary insufficiency jet velocity |
| Estimation of the pulmonary artery diastolic pressure in the presence of patent ductus arteriosus | PA pressure = BP - 4V2 Where PA is pulmonary artery, BP is arm blood pressure, and V is PDA flow velocity |
| Left ventricular (LV) function by shortening fraction of the left ventricle | SF = [(LVIDd - LVIDs)/LVIDd] × 100 Where SF is shortening fraction, LVIDd is left ventricular internal dimension in end-diastole, and LVIDs is left ventricular internal dimension in end-systole |
| Left ventricular function by area shortening of the LV using Simpson’s rule | AS = (LVAd - LVAs)/LVAd Where AS is area shortening, LVAd is LV area in diastole, and LVAs is LV area in systole |
Tricuspid insufficiency jet
In patients in whom a tricuspid insufficiency jet [Figure 14] can be recorded, tricuspid insufficiency jet peak Doppler velocity (V) is used in the estimation of systolic pressure in the PA:

Figure 14. Echo frames from parasternal 2D and Doppler study illustrating tricuspid regurgitant jet (TRJ) by color flow imaging in (A) and by continuous wave Doppler in (B). The magnitude of TRJ is used for the calculation of systolic pressure in the pulmonary artery. The recorded peak velocity of 3.74 m/s by modified Bernoulli equation is calculated to be 56 mmHg gradient (see insert in B). 5 mmHg is presumed right atrial (RA) pressure and should be added to this value. Right ventricle (RV) is labeled. Reproduced from Ref.[19].
PAP = RVP = 4V2 + 5 mmHg
PAP, pulmonary artery systolic pressure; RVP, right ventricular systolic pressure; and V, tricuspid insufficiency jet velocity. 5 mmHg is presumed right atrial pressure.
However, the sonographer must ensure that there is no evidence for obstruction within the right ventricle (RV) (infundibular PS) or obstruction at valvar, supravalvar, branch PA level by methodical Doppler interrogation.
Ventricular septal defect
In patients with ventricular septal defect (VSD), again, the outflow tract of the RV is examined to exclude PS and the LV systolic pressure is assumed to be similar to the arm cuff BP following exclusion of obstruction in the outflow tract of the LV. Doppler flow velocity through the VSD is recorded in [Figures 15 and 16]. One can usually assume an unrestrictive VSD if the VSD Doppler velocity is < 2.0 m/s [Figure 15]:

Figure 15. Selected video frames from parasternal long-axis 2D and color Doppler study displaying a ventricular septal defect (VSD) in (A). Pulse Doppler interrogation of the VSD in (B) depicts low velocity (1.5 m/s) indicating that the pressure in the pulmonary artery is likely to be increased (See the text). Aorta (Ao), left atrium (LA), left ventricle (LV), and right ventricle (RV) are labeled. Reproduced from Ref.[20].
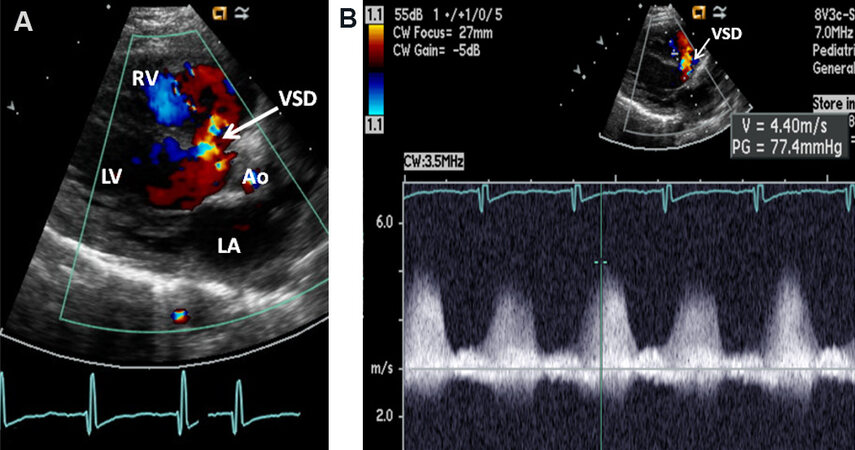
Figure 16. Selected video frames from parasternal long-axis 2D and color Doppler study displaying a ventricular septal defect (VSD) in (A). Continuous wave Doppler interrogation of the VSD in (B) depicts high velocity (4.4 m/s) indicating that the pressure in the pulmonary artery is likely to be low (see the text). Aorta (Ao), left atrium (LA), left ventricle (LV), and right ventricle (RV) are labeled. Reproduced from Ref.[20].
PAP = RVP = LVP
LVP, left ventricular peak systolic pressure (equals to systolic BP); PAP, pulmonary artery systolic pressure; and RVP, systolic pressure in the right ventricle.
We can generally assume there is a restrictive VSD if the VSD Doppler velocity is > 2.0 m/s [Figure 16]. The PA systolic pressure may be assessed by:
PAP = RVP = LVP - 4V2
LVP, peak systolic pressure in the left ventricle (systolic BP), PAP, systolic pressure in the pulmonary artery, RVP, systolic pressure in the right ventricle, and V, velocity magnitude of the VSD flow.
Pulmonary insufficiency jet
In subjects with pulmonary insufficiency jet [Figure 17], the PA diastolic pressure is estimated by the formula:
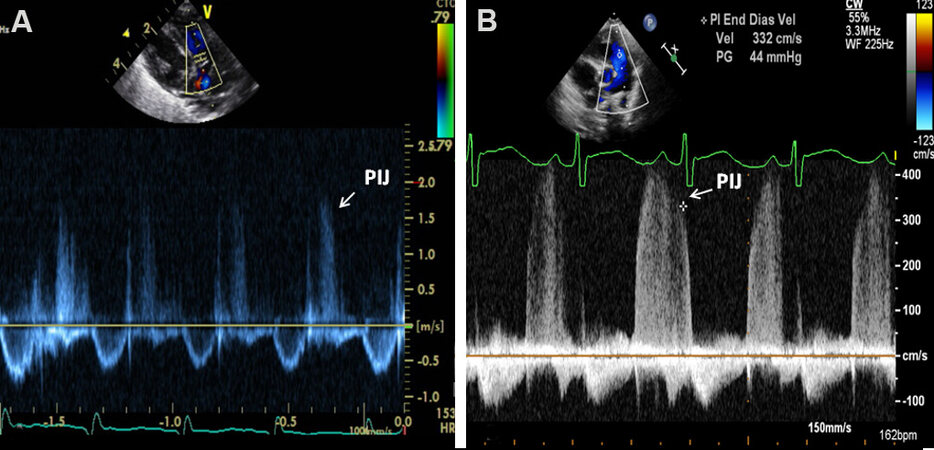
Figure 17. Echo frames from parasternal short-axis 2D (top inserts) and Doppler (bottom sections) study illustrating pulmonary insufficiency jets (PIJs). The magnitude of PIJ is used for the calculation of diastolic pressure in the pulmonary artery. The recorded end-diastolic velocity of 1.6 m/s in (A) by modified Bernoulli equation is calculated to be low, indicating low pressures while an end-diastolic velocity of 3.3 m/s in (B) indicates increased pulmonary artery pressure. Reproduced from Ref.[19].
PA pressure in diastole = 4V2 + 5 mmHg
V, magnitude of pulmonary insufficiency jet velocity. 5 mmHg is presumed RV end-diastolic pressure.
Patent ductus arteriosus
In patients with Patent ductus arteriosus (PDA), the diastolic pressure in the PA may be calculated
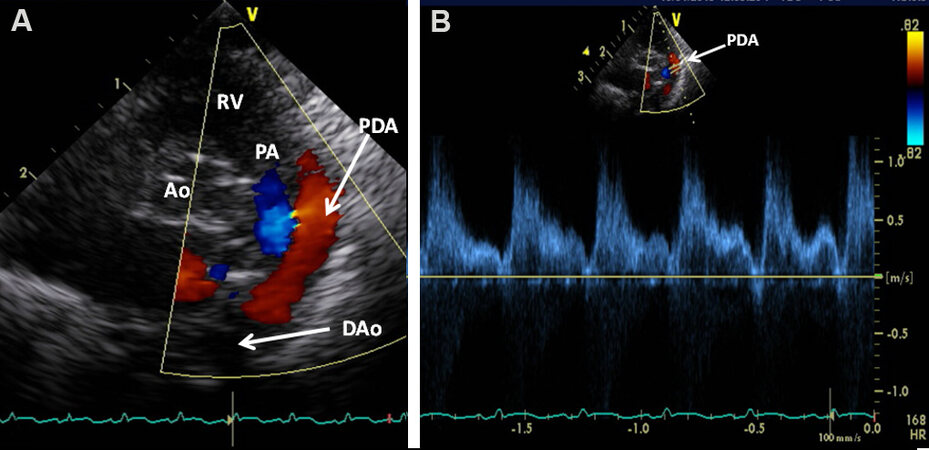
Figure 18. Selected video frames from parasternal short-axis 2D and color Doppler study displaying a patent ductus arteriosus (PDA) with left-to-right shunt in (A). Pulse Doppler interrogation of the PDA in (B) depicts low velocity (1.0-1.4 m/s) indicating that the pressure in the pulmonary artery is likely to be high (see the text). Aorta (Ao), descending aorta (DAo), pulmonary artery (PA), and right ventricle (RV) are labeled. Reproduced from Ref.[20].
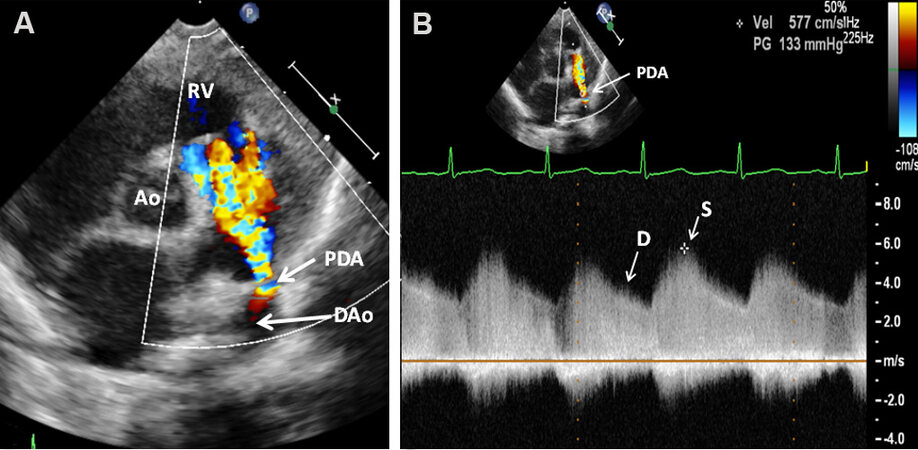
Figure 19. Selected video frames from parasternal short-axis 2D and color Doppler study displaying a patent ductus arteriosus (PDA) with left-to-right shunt in (A). Continuous wave Doppler interrogation of the PDA in (B) depicts high velocity (~4 m/s) indicating that the pressure in the pulmonary artery is likely to be low (see the text). Aorta (Ao), diastolic (D), descending aorta (DAo), pulmonary artery (PA), right ventricle (RV), and systolic (S) are labeled. Reproduced from Ref.[20].
Pulmonary artery pressure = BP - 4V2
BP, arm blood pressure and V, PDA Doppler flow velocity.
If the Doppler flow velocity across the PDA is low [Figure 18], the pressure in the PA is likely to be elevated. On the contrary, high Doppler velocity across PDA [Figure 19] suggests that the pressure in the PA is low.
If no Doppler jets could be recorded in the right heart, indirect signs such as enlargement of the right atrium (RA), dilatation and hypertrophy of the RV, dilatation of the PA, and inter-ventricular septal flattening may signify elevated pressures in the PA. However, the magnitude of the increase of PA pressure may not be quantified. In addition, short acceleration time (< 100 ms) of the PA flow velocity curve and “spike and dome” pattern may also indicate increased PA pressure.
VENTRICULAR FUNCTION
The ventricular systolic function may be assessed by evaluating myocardial mechanics or chamber mechanics or a combination of the two (hybrid). Left and right ventricular systolic functions will be addressed separately. Assessment of ventricular function is generally useful in subjects with known cardiac defects (congenital and acquired) and those without heart defects but with situations such as cardiomyopathy, myocarditis, septic shock, diaphragmatic hernia, and persistent pulmonary hypertension.
Left ventricle
Several echocardiographic techniques, namely PEP/LVET ratio, isovolumic contraction time, the volume of the LV calculated by m-mode echo, the velocity of circumferential shortening fraction, shortening fraction of the LV, percent thickening of the LV posterior wall [Table 4], the velocity of the motion of the posterior wall of the LV, several measurements of opening and closing of the aortic and mitral valves, and others[22,23], have been utilized in the past to evaluate LV function.
Left ventricular function parameters examined
| Parameter | Derivation method |
| Systolic time intervals Pre-ejection period (PEP) Left ventricular ejection time (LVET) Isovolumic contraction time (ICT) PEP/LVET ratio | Onset of QRS to the opening of the aortic valve Opening to the closure of the aortic valve PEP - QMc Ratio of PEP to LVET |
| Left ventricular volumes LV end-diastolic volume (LVEDV) LV end-systolic volume (LVESV) Stroke volume (SV) Ejection fraction (EF) Cardiac output (COP) | LVLDV = 1.05 × LVEDD3 LVLSV = 1.05 × LVESD3 SV = LVEDV - LVESV EF = SV/LVEDV COP = SV × heart rate |
| Shortening fraction | SF = [(LVEDD - LVESD)/LVEDD] × 100 |
| Velocity of circumferential fiber shortening (Vcf) | Vcf = (LVEDD - LVESD)/(LVEDD × LVET) |
| Percent thickening of LV posterior wall | [(LV posterior wall thickness in end-systole - LV posterior wall thickness in end-diastole)/LV posterior wall thickness in end-diastole) × 100] |
More recently, LV volumes and ejection fraction by 2D (Simpson, Biplane, Bullet), wall stress at end-systole-to-circumferential fiber shortening, mid-wall shortening, fiber stress, regional myocardial velocities using tissue Doppler imaging, performance index of the LV myocardium (Tei index), strain and strain rate imaging, LV dP/dt from mitral insufficiency jet, mitral valve annular plane systolic excursion, real-time 3D echo, and others, have been utilized to evaluate the systolic function of the LV. In addition, several methods of evaluation of LV diastolic function have also been described. Additional treatment of this subject may be found in the standard Pediatric Cardiology or Pediatric Echocardiography text books. Some of the above referred techniques are cumbersome, some are load-dependent, some use a large number of assumptions, and some are not validated, and most are not readily applicable to the neonate and young infant. However, there are two methods that can be used with ease and are practical; these are shortening fraction of the LV by utilizing m-mode echocardiogram [Figure 1] and area shortening of the LV by using two-dimensional echo [Figure 20].
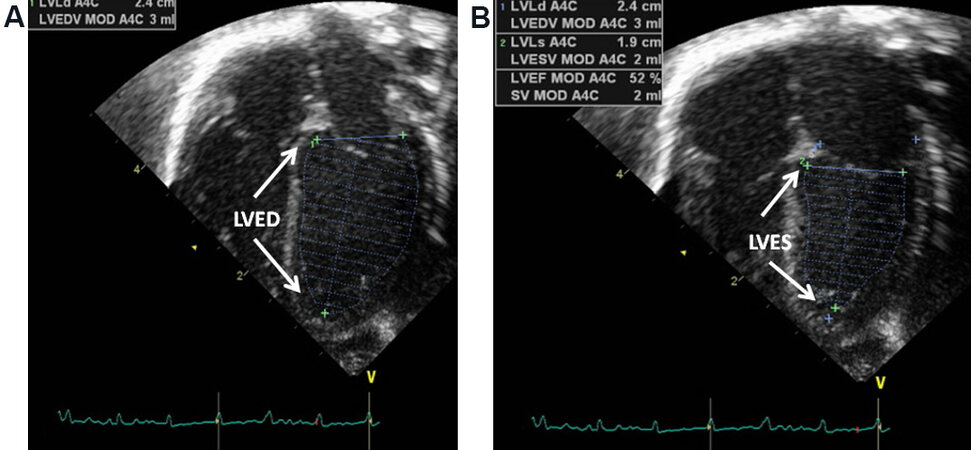
Figure 20. Selected video frames from apical four-chamber location demonstrating the left ventricle in end-diastole (LVED) in (A) and in end-systole (LVES) in (B). Left ventricle (LV) area shortening may be calculated utilizing Simpson’s rule. Area shortening of the LV in this example is 52% (see insert in B). Standard values are 55% to 75% (see text for details). Reproduced from Ref.[19].
LV shortening fraction by M-mode echo
The LV shortening fraction was one of the earliest described echo methods for the evaluation of LV function[24]. It is easy to use and is a frequently utilized method for the rapid evaluation of the global systolic function of the LV. This is calculated by the formula:
SF = [(LVIDd - LVIDs)/LVIDd] × 100
LVIDd, left ventricular end-diastolic dimension; LVIDs, left ventricular end-systolic dimension; and SF, shortening fraction.
The shortening fraction does not depend on the rate of the heart and of the age of the patient with a normal value of 33 ± 5. However, it is load-dependent.
LV area shortening by 2D echo
Another method that is useful is LV area shortening with the use of Simpson’s rule. This technique is particularly valuable in the neonate and premature infant[25]. The LV area shortening is calculated by the formula:
AS = [(LVAd - LVAs)/LVAd] × 100
AS, area shortening; LVAd, LV area in diastole; and LVAs, LV area in systole.
These can easily be recorded with any of the modern echocardiographic machines [Figure 20]. The normal values are 55% to 75%[19]. This method of evaluation of LV function is helpful even in the presence of LV dysynergy or flat-to-paradoxical septal motion, but is still load-dependent.
Right or single ventricle
Right and single ventricles have bizarre shapes and are not amenable to ellipsoid resolution techniques that are used for the LV. Consequently, most cardiologists used to use qualitative visual estimates of RV free wall motion for RV systolic function or how both the free ventricular wall and inter-ventricular septum move for the function of the single ventricle. More recently, fractional area change of the RV[26], tricuspid valve annular plane systolic excursion[27], performance index of the RV myocardium (Tei index)[28], and tricuspid regurgitation jet dP/dt[29] (normal value: dP/dt > 400 mmHg/s) have been successfully used to evaluate the RV function.
UTILITY OF ECHOCARDIOGRAPHY IN EVALUATING MULTIPLE NEONATAL ISSUES
Neonate in distress
Cyanosis and respiratory distress due to non-cardiac causes may be seen in a number of neonates[30,31]. The non-cardiac causes are multiple: (1) diseases of the pulmonary parenchyma - hyaline membrane disease, pneumonia, aspiration syndrome, and rare conditions like bronco-pulmonary dysplasia, pulmonary hemorrhage, and Wilson-Mikity syndrome; (2) disorders producing mechanical interference of the function of the lung - pneumothorax, pneumo-mediastinum, diaphragmatic hernia, tracheo-esophageal fistula, and lobar emphysema; (3) persistent fetal circulation; (4) neonatal asphyxia; (5) disorders of the central nervous system - intracranial hemorrhage, intra-cerebral malformations, severe intracranial infections, and primary seizure disorders; (6) polycythemia; (7) methemoglobinemia; (8) hypoglycemia; (9) pulmonary (lung) hypoplasia; (10) shock and sepsis; and (11) maternal drug transmission or effects of withdrawal; and others. Neonates with all these disease entities are expected to have structurally normal hearts. Evaluation of such infants with echo-Doppler examination can unmistakably show that the heart anatomy and function are normal. In a few babies accompanying CCD may be discovered, which should be dealt with on the basis of the degree of hemodynamic abnormality.
In some neonates, the PA pressures are increased and in others depressed LV or RV function may be present; these and other issues can be clarified by the echocardiographic evaluation as discussed in the earlier portions of this paper and provide assistance in the clinical management.
Infant of diabetic mother
Infant of diabetic mother (IDM) babies have a higher incidence of CCDs and persistent pulmonary hypertension than normal infants. These abnormalities can easily be identified by echo-Doppler studies. IDM babies also frequently exhibit hypertrophy of the LV, similar to that seen in hypertrophic cardiomyopathy (HCM). The LV posterior wall and inter-ventricular septal thickness can easily be seen and measured by echocardiography; there is usually a disproportionate ventricular septal hypertrophy [Figure 21]. The ventricular cavity is almost completely obliterated during systole [Figure 22]. If there is LV outflow tract obstruction, this can be visualized and quantified by Doppler studies [Figure 23]. The LV hypertrophy of IDMs resolves with time (usually by 3 to 6 months) in contradistinction to HCM in which there will be no regression of LV hypertrophy; the hypertrophy may even increase in severity with time.
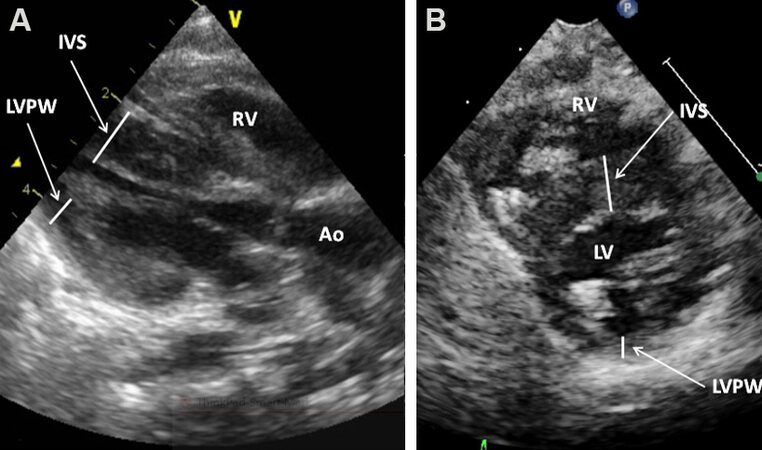
Figure 21. Selected video frames from parasternal long in (A) and short in (B) axis 2D study illustrating severely thickened inter-ventricular septum (IVS) in an infant of a diabetic mother (IDM). Aorta (Ao), left ventricle (LV), LV posterior wall (LVPW), and right ventricle (RV) are marked. Reproduced from Ref.[19].
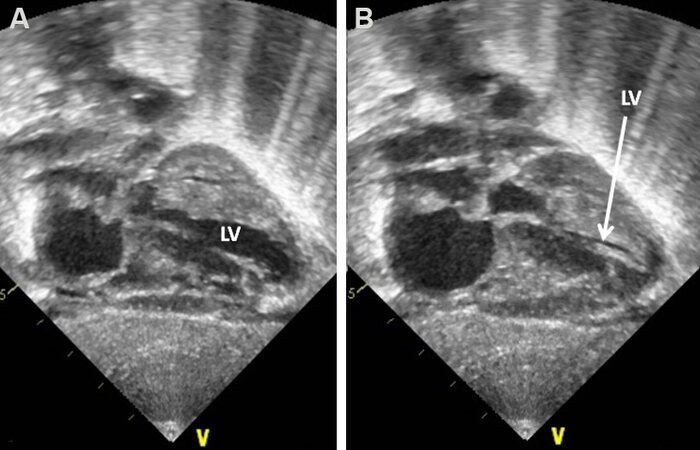
Figure 22. Selected video frames from subcostal views of the left ventricle (LV) in diastole in (A) and in systole in (B) demonstrating complete obliteration of the LV cavity in systole (arrow in B) in an infant of a diabetic mother. Reproduced from Ref.[19].
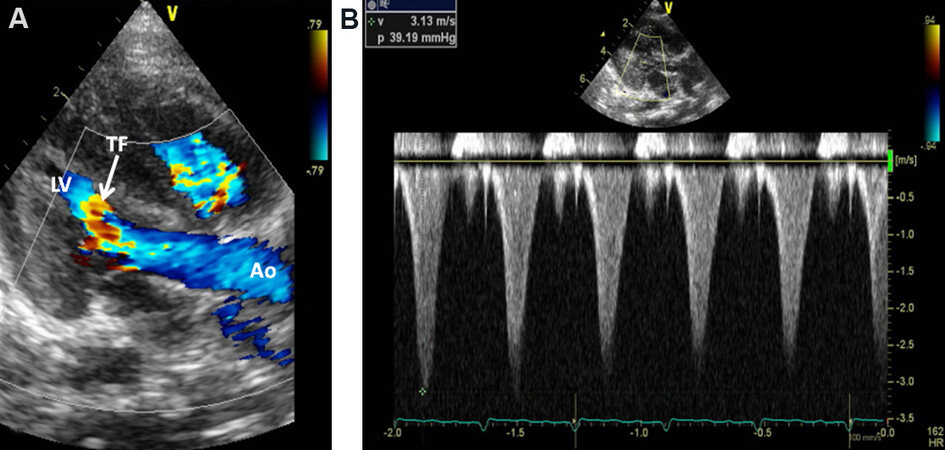
Figure 23. Selected video frames from parasternal long-axis 2D and color Doppler study demonstrating turbulent flow (TF) in the left ventricular (LV) outflow tract in an infant of a diabetic mother in (A). Continuous wave Doppler interrogation in (B) reveals a systolic pressure gradient of 39 mmHg (see the insert in B). The triangular pattern of the Doppler signal is suggestive of subaortic obstruction. Aorta (Ao) is labeled. Reproduced from Ref.[19].
Tracheo-esophageal fistula
Surgical colleagues often request for the identification of the side of the aortic arch prior to surgery of tracheo-esophageal fistulae. Careful review of well penetrated chest X-rays may sometimes demonstrate the descending aortic shadow, but it may not be clear enough to be definitive. Echo is useful in establishing whether the descending aorta descends normally on the left side of the spine or abnormally on the right side. Imaging the first vessel (innominate artery) off the aortic arch helps in this analysis. If it branches into the right common carotid artery and right subclavian artery [Figure 24], the aortic arch is likely to descend on the left. If it does not, it is likely to be coursing on the other side of the spine. Rarely, however, in cases with anomalous origin of the right subclavian artery (where the subclavian artery arises as the fourth branch of the aortic arch), this sign is not helpful. Another assessment of the arch sidedness by echo is the evaluation of the aortic arch relationship to the tracheal rings. If both are visualized, aortic arch sidedness can be designated.
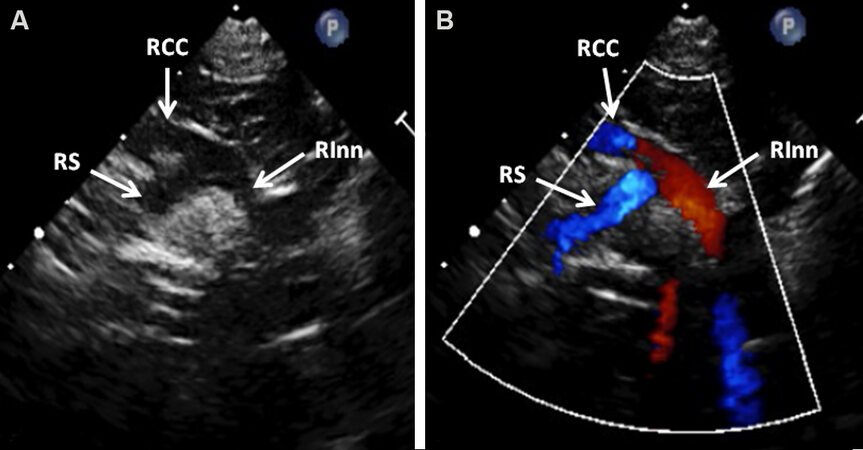
Figure 24. Selected video frames from high parasternal views of the right innominate (RInn) artery illustrating the division of RInn artery into right subclavian (RS) artery and right common carotid (RCC) artery both by two-dimensional in (A) and color Doppler in (B) imaging. This information indicates that the aorta descends on the left (normal) (see text for details). Reproduced from Ref.[19].
Down syndrome
Babies with Down syndrome have a higher (30%-44%) prevalence of heart disease[32,33] when compared to normal infants (< 1%). Most neonatologists and geneticists desire to know if the baby has cardiac involvement. Cardiac murmurs and symptoms of cardiac failure are not usually seen at birth because of high pulmonary vascular resistance. Echocardiographic studies are valuable in determining whether the baby has a common AV septal defect (the most frequent heart abnormality in babies with Down syndrome) [Figures 25 and 26], another type of defect, or a normal heart.
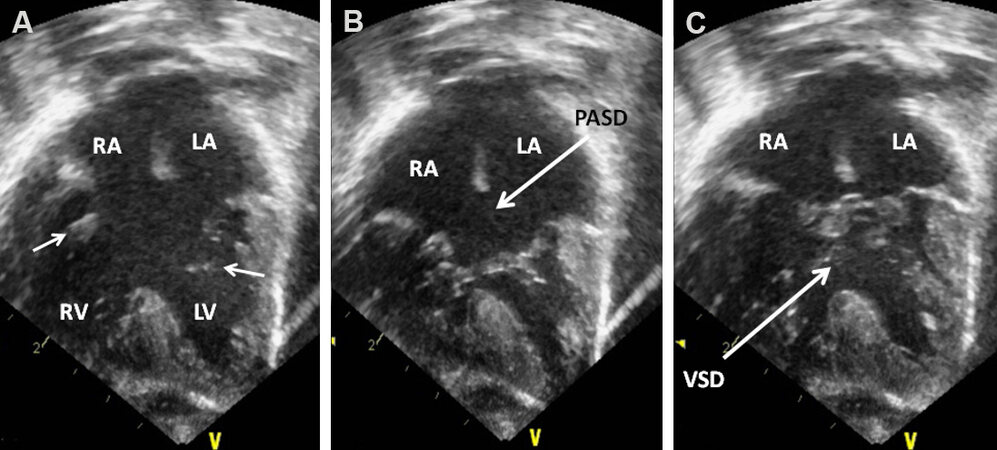
Figure 25. Echocardiographic study in apical four-chamber views of an infant with Down syndrome demonstrating common atrioventricular septal defect. In (A), the atrioventricular valve is open [small arrows in (A)] while in (B) and in (C) the atrioventricular valve is closed. Note a large ostium primum atrial septal defect (PASD) in “B” and a large ventricular septal defect (VSD) in (C). Left atrium (LA), left ventricle (LV), right atrium (RA), and right ventricle (RV) are labeled. Reproduced from Ref.[20].
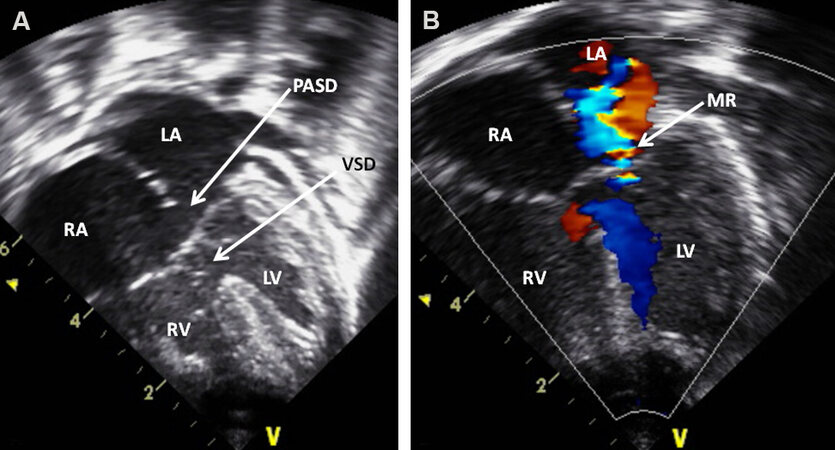
Figure 26. Echocardiographic studies in apical four-chamber views of an infant with Down syndrome demonstrating common atrioventricular septal defect. Note an ostium primum atrial septal defect (PASD) and a ventricular septal defect (VSD) (arrows) in (A). Mitral regurgitation (MR) (arrow) is shown in (B). Left atrium (LA), left ventricle (LV); right atrium (RA), and right ventricle (RV) are labeled. Reproduced from Ref.[20].
PDAs in the premature
The issues related to PDA in premature infants will be discussed in Part II of this series.
Cardiomegaly
Enlargement of the heart may be visualized on chest roentgenogram. The enlargement of the cardiac silhouette may be due to poor inspiration, a prominent thymus, dilated left or right ventricle, or pericardial effusion. While a seasoned radiographer may be able to help distinguish these entities, it is not always easy to make this distinction. However, echocardiograms are very helpful and confirmatory in identifying the cause of cardiomegaly. The normal structure of the heart can be established in situations associated with poor inspiration or a prominent thymus. In patients with dilated ventricles, they can easily be identified as shown [Figures 27-29]. Similarly pericardial effusion [Figures 30 and 31] can be identified.
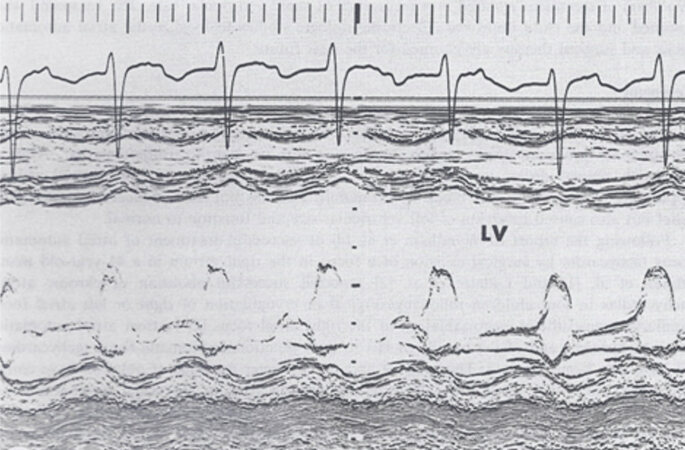
Figure 27. M-mode echocardiogram of a baby who had cardiomegaly on a chest X-ray demonstrated a severely enlarged left ventricle (LV) with markedly diminished LV systolic function (shortening fraction by m-mode echo was 13%).

Figure 28. Chest roentgenogram (A) exhibits cardiac enlargement. M-mode echo cardiogram (B) of the same baby demonstrates dilatation of the left ventricle (LV), thought to be secondary to dilated cardiomyopathy.
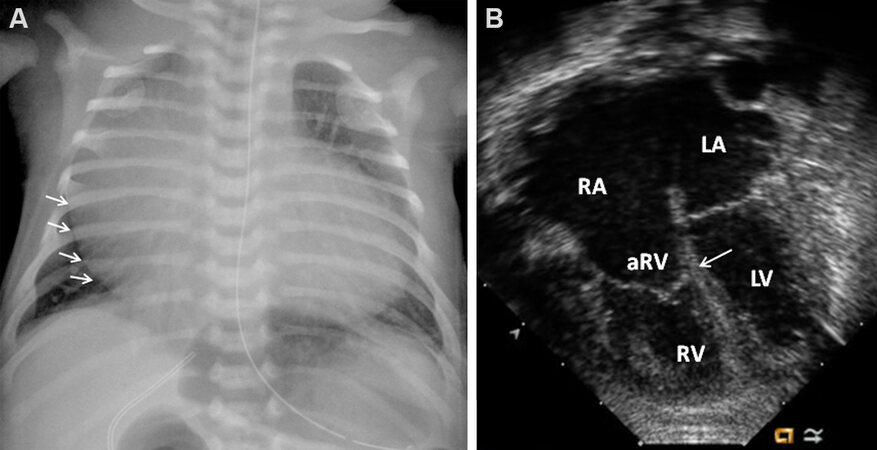
Figure 29. Chest X-ray (A) of a neonate demonstrating severe cardiomegaly who on a two-dimensional echocardiogram (B) revealed Ebstein’s anomaly of the tricuspid valve [arrow in (B)] with marked tricuspid insufficiency (not shown). Arrows in the (A) demarcate enlarged right atrium (RA). aRV: Atrialized right ventricle; LA: left atrium; LV: left ventricle; RV: right ventricle.
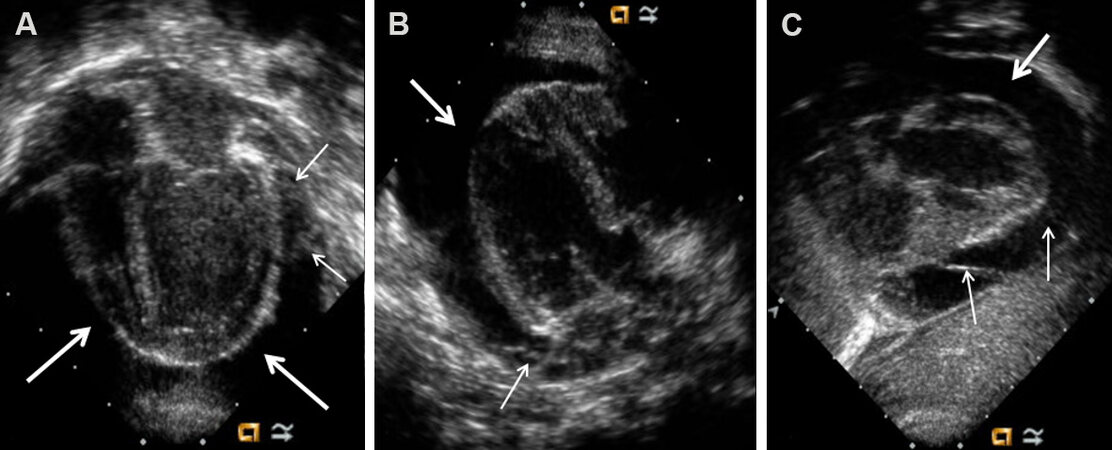
Figure 30. Selected video frames from apical four-chamber [(A) and (B)] and parasternal short-axis (C) projections of the heart in a baby with cardiac enlargement on a chest X-ray demonstrating a large pericardial effusion (thick arrows). Thin arrows mark fibrin strands within the effusion. Reproduced from Ref.[19].
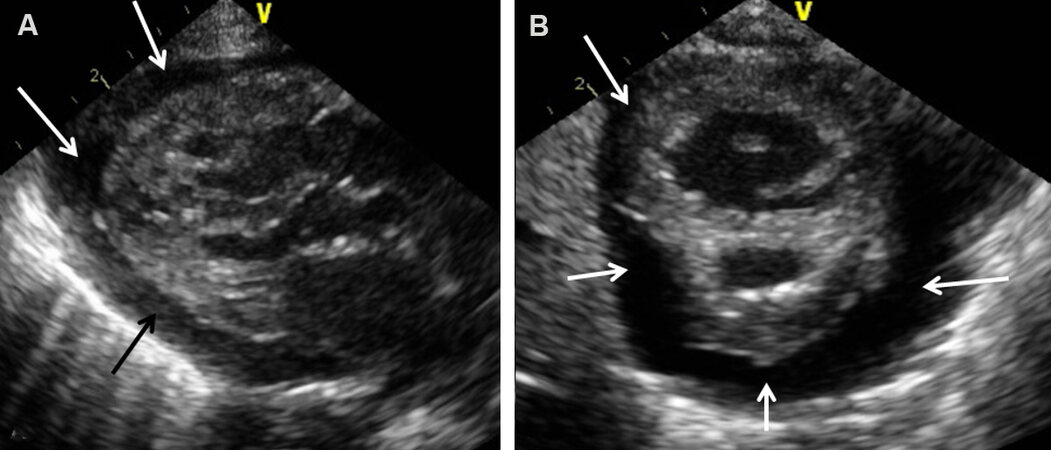
Figure 31. Selected video frames from parasternal long in (A) and short in (B) axis views in an infant with cardiac enlargement on chest X-ray demonstrate a large pericardial effusion (arrows). Reproduced from Ref.[19].
COMMONLY ENCOUNTERED HEART DEFECTS IN THE NEONATE
Echocardiographic studies are useful in evaluating cyanotic heart defects[19], acyanotic heart defects[20], as well as asymptomatic heart murmurs[34] in the newborn. Therefore, commonly encountered acyanotic and cyanotic CHDs in the neonate will be reviewed along with those of infants and children in Parts II and III of this series, respectively.
SUMMARY AND CONCLUSIONS
An abbreviated appraisal of the principles of echocardiographic and Doppler techniques was reviewed. M-mode and 2D echo and PW, CW, and color flow Doppler examination from the usual echocardiographic views are documented. Methods of assessment of pressures in the PA and a review of techniques used for determining ventricular (left, right and single) function were presented. Normality of the cardiac structure and function can be established in patients who have non-cardiac reasons of cyanosis or respiratory distress, namely, persistent fetal circulation, neonatal asphyxia, central nervous system abnormalities, hypoglycemia, polycythemia, methemoglobinemia, pulmonary hypoplasia, shock and sepsis, and others. The usefulness of echocardiograms in the evaluation of IDM, descending aortic location in tracheo-esophageal fistula patients, cardiac defects in Down syndrome, and cardiac enlargement was elucidated.
DECLARATIONS
AcknowledgmentsA large number of echocardiographic pictures were used as figures in this paper; a significant portion of these echoes were obtained at the Children’s Memorial Hermann Hospital, Houston, Texas. I take this opportunity to thank the sonographers for their diligence in securing high-quality echocardiograms.
Authors’ contributionsThe author contributed solely to the article.
Availability of data and materialsNot applicable.
Financial support and sponsorshipNone.
Conflicts of interestThe author declared that there are no conflicts of interest.
Ethical approval and consent to participateNot applicable.
Consent for publicationNot applicable.
Copyright© The Author(s) 2022.
REFERENCES
1. Lindner JR. Contrast echocardiography: current status and future directions. Heart 2021;107:18-24.
2. Truman AT, Rao PS, Kulangara RJ. Use of contrast echocardiography in diagnosis of anomalous connection of right superior vena cava to left atrium. Br Heart J 1980;44:718-23.
3. Ritter SB. Transesophageal real-time echocardiography in infants and children with congenital heart disease. J Am Coll Cardiol 1991;18:569-80.
4. Ungerleider RM, Kisslo JA, Greeley WJ, et al. Intraoperative echocardiography during congenital heart operations: experience from 1,000 cases. Ann Thorac Surg 1995;60:S539-42.
5. Singh GK, Marino C, Rao PS. Ultrasound as an adjunct to cardiac intervention in the pediatric patient. J Invasive Cardiol 1996;8:341-9.
6. Seward JB, Khandheria BK, McGregor CG, Locke TJ, Tajik AJ. Transvascular and intracardiac two-dimensional echocardiography. Echocardiography 1990;7:457-64.
7. Hijazi ZM, Wang Z, Cao Q, Koenig P, Waight D, Lang R. Transcatheter closure of atrial septal defects and patent foramen ovale under intracardiac echocardiographic guidance: Feasibility and comparison with transesophageal echocardiography. Catheter Cardiovasc Interv 2001;52:194-9.
8. Harrison J, Sheikh KH, Davidson CJ, et al. Balloon angioplasty of coarctation of the aorta evaluated with intravascular ultrasound imaging. J Am Coll Cardiol 1990;15:906-9.
9. Shlofmitz E, Kerndt CC, Parekh A, Khalid N. Intravascular ultrasound. In: StatPearls. Treasure Island, FL: StatPearls Publishing; 2021.
10. Biliciler-Denktas G, Ozcelik N. Fetal echocardiography - Part I. In: Rao PS, Vidyasagar D, editors. A multidisciplinary approach to perinatal cardiology volume 1. New Castle upon Tyne: Cambridge Scholars Publishing; 2021. p. 60-96.
11. Ozcelik N, Agarwal AK, Gupta M. Fetal echocardiography - Part II - Congenital heart defects and their management. In: Rao PS, Vidyasagar D, editors. A multidisciplinary approach to perinatal cardiology volume 1. New Castle upon Tyne: Cambridge Scholars Publishing; 2021. p. 96-154.
12. Banerjee A, Patel HT, Pandain NG. Role of three-dimensional echocardiographic reconstruction in transcatheter occlusion of atrial septal defects. In: Rao PS, Kern MJ, editors. Catheter based devices for treatment of noncoronary cardiovascular disease in adults and children. Philadelphia, PA: Lippincott, Williams & Wilkins; 2003. p. 133-141.
13. Jone PN. Applications of three-dimensional transesophageal echocardiography in congenital heart disease. Echocardiography 2020;37:1665-72.
14. Hatle L, Angelson B. Doppler ultrasound in cardiology: physical principles and clinical applications. Philadelphia: Lea and Fibiger; 1982.
15. Rao PS. Doppler echocardiography in non-invasive diagnosis of heart disease in infants and children. Indian J Pediatr 1988;55:80-95.
16. Goldberg SJ, Allen HD, Marx GR, Donnerstein RL. Doppler echocardiography. Philadelphia: WB Saunders; 1988.
17. Duncan WJ. Color Doppler in clinical cardiology. Philadelphia, PA: WB Saunders Company; 1987.
18. Nanda NC. Textbook of color Doppler echocardiography. Philadelphia: Lea and Febiger; 1989.
19. Rao PS. Echocardiographic evaluation of neonates with suspected heart disease. In: Rao PS, Vidyasagar D, editors. A multidisciplinary approach to perinatal cardiology volume 1. New Castle upon Tyne: Cambridge Scholars Publishing; 2021. p. 303-90.
20. Rao PS. Other acyanotic heart defects presenting in the neonate. In: Rao PS, Vidyasagar D, editors. A multidisciplinary approach to perinatal cardiology volume 2. New Castle upon Tyne: Cambridge Scholars Publishing; 2021. p. 562-607.
21. Rao PS. Echocardiography. In: Rao PS, editor. Pediatric cardiology: how it has evolved over the last 50 years. New Castle upon Tyne: Cambridge Scholars Publishing; 2020. p. 89-132.
22. Rao PS, Kulangara RJ. Echocardiographic evaluation of global left ventricular performance in infants and children. Indian Pediat 1982;19:21-32.
23. Rao PS. Non-invasive evaluation of left ventricular function in infants and children. Saudi Med J 1983;4:195-209.
24. Belenkie I, Nutter DO, Clark DW, Mccraw D, Raizner AE. Assessment of left ventricular dimensions and function by echocardiography. Am J Cardiol 1973;31:755-62.
25. Lee LA, Kimball TR, Daniels SR, Khoury P, Meyer RA. Left ventricular mechanics in the preterm infant and their effect on the measurement of cardiac performance. J Pediatr 1992;120:114-9.
26. Clark SJ, Yoxall CW, Subhedar NV. Measurement of right ventricular volume in healthy term and preterm neonates. Arch Dis Child Fetal Neonatal Ed 2002;87:F89-93; discussion F93-4.
27. Arce OX, Knudson OA, Ellison MC, et al. Longitudinal motion of the atrioventricular annuli in children: reference values, growth related changes, and effects of right ventricular volume and pressure overload. J Am Soc Echocardiogr 2002;15:906-16.
28. Williams RV, Ritter S, Tani LY, Pagotto LT, Minich L. Quantitative assessment of ventricular function in children with single ventricles using the Doppler myocardial performance index. Am J Cardiol 2000;86:1106-10.
29. Singbal Y, Vollbon W, Huynh LT, Wang WY, Ng AC, Wahi S. Exploring noninvasive tricuspid dP/dt as a marker of right ventricular function. Echocardiography 2015;32:1347-51.
30. Rao PS. An approach to the diagnosis of cyanotic neonate for the primary care provider. Neonatology Today 2007;2:1-7.
31. Rao PS. An approach to the diagnosis of cyanotic neonates for the primary care provider. In: Rao PS, Vidyasagar D, editors. A multidisciplinary approach to perinatal cardiology volume 1. New Castle upon Tyne: Cambridge Scholars Publishing; 2021. p. 284-302.
32. Rao PS, Salehbhai M. Congenital heart disease in Down's syndrome - its genotype distribution. Pediatr Res 1976;10:370.
33. Freeman SB, Taft LF, Dooley KJ, et al. Population-based study of congenital heart defects in Down syndrome. Am J Med Genet 1998;80:213-7.
Cite This Article
Export citation file: BibTeX | RIS
OAE Style
Rao PS. Echocardiography: an overview - part I. Vessel Plus 2022;6:24. http://dx.doi.org/10.20517/2574-1209.2021.91
AMA Style
Rao PS. Echocardiography: an overview - part I. Vessel Plus. 2022; 6: 24. http://dx.doi.org/10.20517/2574-1209.2021.91
Chicago/Turabian Style
Rao, P. Syamasundar. 2022. "Echocardiography: an overview - part I" Vessel Plus. 6: 24. http://dx.doi.org/10.20517/2574-1209.2021.91
ACS Style
Rao, PS. Echocardiography: an overview - part I. Vessel Plus. 2022, 6, 24. http://dx.doi.org/10.20517/2574-1209.2021.91
About This Article
Special Issue
Copyright

Data & Comments
Data
0

 Cite This Article 9 clicks

 Like This Article 17
likes
Like This Article 17
likes


Comments
Comments must be written in English. Spam, offensive content, impersonation, and private information will not be permitted. If any comment is reported and identified as inappropriate content by OAE staff, the comment will be removed without notice. If you have any queries or need any help, please contact us at support@oaepublish.com.