
Review of CT perfusion and current applications in posterior circulation stroke

Abstract
Acute ischemic stroke is a leading cause of death and disability. Treatment efficacy is highly time-dependent. Approximately 20% of acute ischaemic stroke occurs in the posterior circulation. Clinical presentation of posterior circulation stroke is subtle. Diagnosis is often delayed and frequently missed. CT perfusion has improved diagnostic accuracy and been integral to guiding acute therapy in patients with anterior circulation stroke. There are limited studies assessing the role of CT perfusion in posterior circulation stroke. This review provides a reference for interpretation of CT perfusion and summarises current evidence relating to applications in acute posterior circulation stroke.
Keywords
INTRODUCTION
Stroke is globally one of the leading causes of death and disability. Acute treatment for ischaemic stroke is highly effective but partly time-dependent. Treatment depends upon expedient clinical appraisal of medical imaging. Current guidelines use a specific time window from stroke onset to determine eligibility for reperfusion therapy[1,2]. Due to this limited time frame, only a minority of potentially eligible strokes receive acute therapy[3]. Early studies established the role of thrombolysis and endovascular thrombectomy within 4.5 h and 6 h from symptom onset, respectively, of an eligible ischaemic stroke. More recent trials have used advanced imaging to demonstrate a benefit of these treatments over an extended time window[3-7]. These studies have expanded the number of patients eligible for acute reperfusion therapies.
Multimodal imaging including CT perfusion (CTP) is recommended by most international guidelines as part of the imaging work up for acute stroke. CTP follows the temporal course of an IV bolus of iodinated contrast through the brain parenchyma to calculate multiple parameters. It has allowed clinicians to select patients for therapy based on both time and tissue based characteristics. As such, this modality has underpinned patient selection to trials demonstrating a benefit of acute therapy in the extended time window.
Approximately 20% of strokes occur in the posterior circulation[8,9]. Compared to anterior circulation stroke (ACS), posterior circulation acute ischaemic strokes (PCS) are misdiagnosed three times more frequently[10,11]. PCS frequently present with non-specific symptoms including headache, dizziness and gait disturbance, making the diagnosis difficult on clinical grounds alone[11]. Studies have reported that up to 90% of PCS do not meet the criteria for TIA at first medical contact[12]. This often leads to a delayed or inaccurate diagnosis.
To date, there have been few studies exploring the role of CTP in PCS. Given the limited evidence and technical challenges[13] of performing CTP for PCS, uptake has been limited. Advances in image acquisition, scanner technology and software have overcome many of these barriers. Recent studies of CTP for PCS have demonstrated promising utility including improved diagnostic accuracy[14] and prediction of functional outcomes[15,16].
This review aims to: (1) provide an overview of the technical aspects involved in CTP acquisition and post processing; (2) define common CTP parameters reported by existing software; (3) explore the evidence regarding current ischaemic core and penumbra thresholds; (4) discuss common technical pitfalls impacting CTP parameters; and (5) summarise existing evidence relating to CTP in PCS including specific technical challenges and current applications.
OVERVIEW OF CTP
Acquisition of CTP
CTP protocol varies by institution and scanner. Brain coverage is dependent on the number and width of CT detectors. Ideally there should be at least 80 mm of axial coverage[17]. However, to fully capture the posterior fossa and supratentorial brain, whole brain coverage (> 100 mm) is ideal. After administration of iodinated contrast, a four dimensional sequence of scans are acquired over a designated period of time. Ideally, to avoid bolus truncation, images should be captured over a minimum of 60 s[18,19]. The acquired source images effectively track the course of contrast agent through the brain vasculature and tissue.
Post processing of CTP
The four-dimensional source images are converted into a range of perfusion maps which represent different haemodynamic parameters. Maps are generated via deconvolutional algorithms based on the arterial input function and passage of contrast through each voxel. Common outputs from CTP include mean transit time (MTT), cerebral blood flow (CBF), and cerebral blood volume (CBV). Maps of contrast transit such as Tmax or Delay Time are also produced, depending on software. These parameters are further processed to provide maps that estimate the volume of tissue that is irreversibly damaged, or infarcted (ischemic core), and ischemic tissue at risk of future infarction without reperfusion (penumbra).
Several software packages exist for determination of these parametric maps. Calculation of these maps is vendor-specific with no standardised method for transformation of the raw data. Different mathematical techniques underpin the output represented by these maps[20]. Studies have shown significant differences in perfusion parameters derived from identical source data depending on software package[21] and post processing method used[20] [Figure 1A-H, Figure 2A-H].
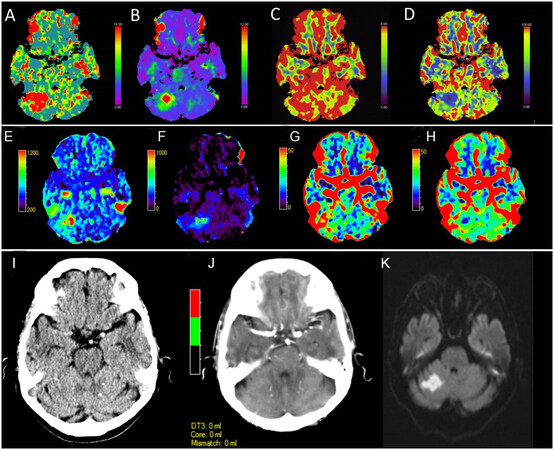
Figure 1. Perfusion maps from an acute posterior circulation stroke causing right cerebellar infarction at 1 h and 23 min after symptom onset. Thrombolysis was not given due to a National Institute of Health stroke score (NIHSS) of 0. Maps are from the Siemens syngo.CT Neuro perfusion package which include (A) MTT, (B) Tmax, (C) CBV and (D) CBF. Images demonstrate an acute right cerebellar perfusion lesion with involvement of the superior cerebellar artery (SCA) vascular territory. No vessel occlusion was visualised on CT angiography. The perfusion lesion is most prominent on the (A) MTT and (B) Tmax and (D) CBF maps. Perfusion maps from the same acute posterior circulation stroke seen in Figure 1A-D. Map outputs are from the MiStar neuro perfusion package which include (E) MTT, (F) DT, (G) CBV and (H) CBF. Images demonstrate an acute right cerebellar lesion most evident on the (E) Tmax, (F) DT and (G) CBF maps. Similar to the Siemens syngo.CT Neuro perfusion package, the acute lesion is not well visualised on the CBV map. There is a notable difference in the volume of the perfusion lesion seen across the packages. This reflects the different algorithms employed by the two software proprietors in determination of the perfusion maps. Evolution of the acute posterior circulation stroke demonstrated in Figure 1. (I) Initial non-contrast CT at 1 h and 23 min after symptom onset demonstrates no acute change. (J) Initial automated core-penumbra map from the MiStar neuro perfusion package using the conventional thresholds for core and penumbra of CBV < 30% and DT > 3 s demonstrates no detectable perfusion lesion (although this may also relate to the relatively small size of the lesion as the software has a minimum volume criteria for core/penumbra to try to reduce false core/penumbra from noise). (K) Progress diffusion weighted magnetic resonance imaging at 20 h and 30 min after onset of symptoms demonstrating an established left cerebellar infarct. MTT: Mean transit time; CBV: cerebral blood volume; CBF: cerebral blood flow; DT: delay time.
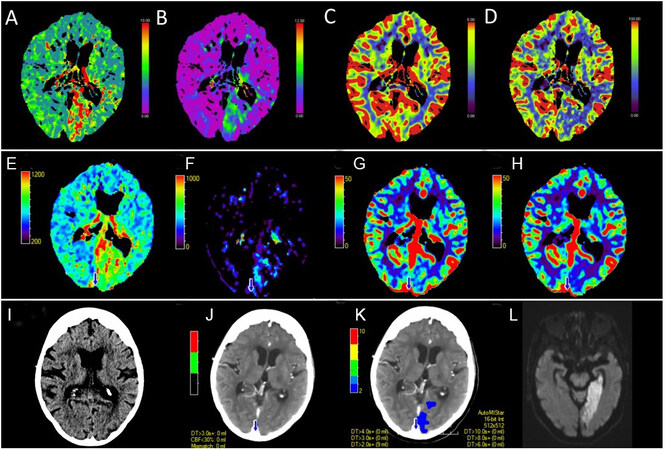
Figure 2. Perfusion maps from an acute posterior circulation stroke causing left posterior cerebral artery infarction at 7 h and 15 min after last known well time. Maps are from the Siemens syngo.CT Neuro perfusion package which include (A) MTT, (B) Tmax, (C) CBV and (D) CBF. Images demonstrate an acute left occipital perfusion lesion involving the posterior cerebral artery vascular territory. The vessel occlusion was not seen on CT angiography. Changes are most prominent on the (A) MTT and (B) Tmax and (D) CBF maps. Perfusion maps from the same acute posterior circulation stroke seen in Figure 2A-D. Map outputs are from the MiStar neuro perfusion package which include; (E) MTT, (F) DT, (G) CBV and (H) CBF. Images demonstrate an acute left occipital lesion most evident on the (E) Tmax, (F) DT and (H) CBF maps. Similar to the Siemens syngo.CT Neuro perfusion package, the acute lesion is not well visualised on the CBV map. There is a notable difference in the volume of the perfusion lesion seen across the packages. This reflects the different algorithms employed by the two software proprietors in determination of the perfusion maps. Evolution of the acute posterior circulation stroke demonstrated in Figure 2. (I) Initial non-contrast CT at 7 h and 15 min after last known well time demonstrates no acute change. (J) Initial summary map from the MiStar neuro perfusion package using the conventional thresholds for core and penumbra of CBV < 30% and DT > 3 s does not demonstrate a detectable perfusion lesion. (K) Delay time map demonstrates a perfusion lesion at the threshold of DT > 2 s (but below the DT 3 s threshold for “penumbra”. (L) Progress diffusion weighted magnetic resonance imaging at 24 h and 40 min after last known well time demonstrating an established right posterior cerebral artery infarct. Discordance with the automated map and similarity to the DT > 2 lesion suggest conventional perfusion thresholds are not optimised for posterior circulation strokes. Both cases also highlight the need not to simply rely on the core/penumbra maps, but to look at all the perfusion maps. MTT: Mean transit time; CBV: cerebral blood volume; CBF: cerebral blood flow; DT: delay time.
Parameters
There are several considerations when interpreting perfusion maps. The normal ranges for perfusion parameters vary by anatomical location[22], age and neurological state[23]. Cerebral haemodynamics are autoregulated via complex metabolic mechanisms including blood pressure, arterial partial pressure of carbon dioxide and pH.
Perfusion parameters represent the temporal characteristics of contrast as it travels from the arterial system through the brain parenchyma. The two principal determinants of this transit are arterial flow and intrinsic tissue characteristics. Arterial flow is approximated by the arterial input function. Factors that cause delay and dispersion of arterial flow include: reduced cardiac output, arterial stenosis, and injection rate[24]. Tissue perfusion is mathematically deducted via deconvolution using the arterial input function to account for arterial flow.
Mean transit time
MTT represents the mean time for blood to pass through a voxel. It is correlated with mean arterial pressure and cerebral perfusion pressure and is measured in seconds[25].
Cerebral blood volume
CBV is the fraction of blood vessels in a single voxel. It is measured in millilitres/100 g[26].
Cerebral blood flow
CBF is the flow rate of blood through a single voxel in a given time. It is mathematically related to CBV and MTT via the central volume principle which states CBF = CBV/MTT[26]. CBF is measured in
Time-density relationship measures (Time to peak, Time to drain, Tmax and Delay Time)
These parameters provide a visual interpretation of the time density curve. They reflect the time taken from the start of the scan to the maximum recordable intensity of the contrast medium in brain tissue. Although related, different mathematical methods underlie the calculation of these perfusion parameters[22,27]. An in-depth discussion of these parameters lies outside the scope of this review. Time-density relationship parameters are measured in seconds.
Time to peak
Time to peak (TTP) is a simple yet robust measure of blood flow[28,29]. This parameter represents the time from contrast injection to the maximum tissue enhancement value. Importantly, this parameter does not incorporate deconvolution, as such is sensitive to delay and dispersion of contrast bolus. Failure to correct for delay and dispersion may lead to overestimation of core and underestimation of penumbral volumes[30,31].
Tmax
Tmax is also known as the time of peak of the deconvolved tissue residual function[32]. This parameter represents the time from arterial peak to the peak of the tissue concentration curve, after a deconvolution algorithm has been applied. This measure is sensitive to delay in arrival of the contrast bolus. Indeed, in normal tissue Tmax should equal zero.
Delay time
Delay Time (DT) is somewhat similar to Tmax, but has been corrected for both delay and dispersion of the contrast bolus. The problem with not correcting for both delay and dispersion is that the contrast bolus is dispersed (via collateral pathways) by the time it reaches the ischemic region. This means that the “real” tissue arterial concentration/time curve is “shorter and fatter” than in the proximal arteries[33,34]. Failure to correct for this leads to overestimation of the true contrast transit and inaccurate estimation of “true” perfusion lesion volume[30].
Time to drain
This is a deconvolution-based parameter which measures the time taken for contrast medium washout. It is based on the time from arterial enhancement to tissue enhancement (Time to start) and MTT[35]. It is sensitive to multiple haemodynamic disturbance not necessarily captured by Tmax, delay time or Time to peak
CTP THRESHOLDS
Core
Accurate measurement of ischemic core has been fundamental for patient selection in clinical trials of acute reperfusion therapy. Large core volume is a predictor of poor outcome[36] and complication[37] following acute reperfusion therapies. Conversely, overestimation of core may unnecessarily preclude patients from receiving beneficial treatment[30].
Both CBV[22,38] and CBF have been validated to estimate ischaemic core volume. While early studies and guidelines utilised CBV, more recently, CBF thresholds have become the standard for defining core estimates. Multiple CBF thresholds have been correlated with final infarct size[20,39,40]. A CBF threshold of < 30% has been most extensively validated, but only in the anterior circulation[17,32,34]
It is important to note that studies defining the optimal CTP thresholds for core have been typically based on final infarct size on follow up MRI. CTP measures the transit of contrast through brain tissue rather than cellular injury (which Diffusion-weighted imaging/DWI lesions reflect)[41]. As such, these thresholds do not represent real infarct tissue but are projected representations of tissue fate. Several factors have been shown to result in CTP overestimates of core estimates including: a shorter time from stroke onset to imaging[42] and rapid reperfusion[43]. Conversely, in conditions where blood flow and volume are restored to infarcted brain tissue, such as late recanalisation or improved collateral flow, CTP may appear normal, despite a relatively large infarct. Wherever possible, clinicians should validate CTP core representations by cross referencing these maps with the “raw” CTP perfusion maps as well as non-contrast CT (NCCT) images to corroborate actual infarct volume.
Penumbra
In stroke, penumbra represents the hypoxic cerebral tissue at risk of irreversible damage which is potentially salvageable with restoration of blood flow. Penumbral volume is equal to the area of critically hypoperfused brain tissue minus the ischaemic core. Early imaging studies exploring penumbra were based on final infarct volume of hemispheric strokes with persistent large artery occlusion[38,41,44].
Several parameters have been validated as successfully approximating penumbra including MTT, Time to drain (TTD), Tmax and DT. Of these markers, DT and Tmax have been shown to be the most accurate markers of penumbra[20]. Delayed time greater than 3 s[17] and Tmax greater than 6 s[32] have become the generally accepted thresholds for quantifying penumbra. Again, however, these thresholds are not validated in the posterior circulation.
Technical factors
Vessel selection
Arterial and venous selection is automated in several perfusion software packages[20,45]. The selection of these landmarks underpins the arterial input function and venous output function used in the deconvolution algorithms that estimate perfusion [Figure 3]. Inaccurate vessel selection negatively impacts the integrity of the perfusion estimates[46,47].
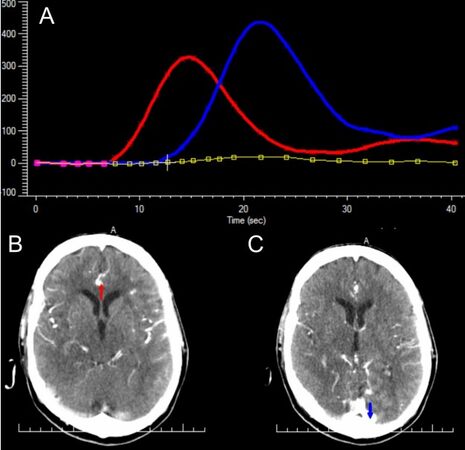
Figure 3. CTP parameters are derived from the measurement of the transit of iodinated contrast through the cerebral vessels and parenchyma. The arterial input function (AIF) and venous output function (VOF) underpin the mathematical calculation of these parameters. (A) A visual representation of the AIF (red line) and VOF (blue line) of an acute basilar artery occlusion 1 h after stroke onset. Mistar neuroperfusion package automatically selects (B) an artery from the anterior circulation for calculation of the AIF and (C) a venous sinus for calculation of the VOF.
Patient positioning and movement
Software packages use the contralateral hemisphere as a reference to detect asymmetries in contrast flow indicative of core or penumbra[26]. Head tilt distorts the axial comparison of anatomical structures leading to spurious results. Patient movement can be corrected to a degree via the software vendors’ automated motion adjustment[48,49]. However, significant patient motion can result in distorted perfusion estimates and, at times, artefactual perfusion “lesions”.
Radiation exposure
A standard CTP acquires at 80 kilovoltage peak and 100 milliamperes-second. Utilising optimised protocols[50] and multidetector scanners[51], the radiation dose is approximately 2 mSv, which is similar to a single head CT[52] or approximately 1 year of natural background radiation. Additional imaging must always balance the improved diagnostic information vs. the risk of extra radiation.
Z-axis coverage
The number of data channels used in the craniocaudal plane (z-axis) and effective detector thickness influence the z-axis coverage of a CT scanner[53]. For example, a 64 row detector scanner with a detector thickness of 0.5 mm has 32 mm of simultaneous z-axis coverage. Detector configuration and z-axis coverage vary considerably by manufacturer[54]. In recent years, there has been growing availability of 320-detector row scanners able to acquire up to 160 mm of brain in a single acquisition[17].
CTP IN THE POSTERIOR CIRCULATION
Studies have routinely demonstrated the utility of CTP perfusion in ACS for both diagnosis[55] and patient selection for acute therapies[3-7]. In contrast, there have been few studies examining the role of CTP in the PCS. To date, studies have been limited to small retrospective populations[56,57] and case reports[58]. We summarise the existing evidence.
Specific challenges
Until recently, restricted axial slice coverage has limited the application of CTP to PCS. Older 16 and 64 detector row scanners have a limited scan range of 20-40 mm in the axial plane. As such, scans have been generally focused on capturing regions supplied by the anterior circulation with limited coverage of posterior circulation structures[59]. This has resulted in missed infarcts and underestimates of the ischaemic core and penumbra[60]. Beam hardening artifact and radiation dose have also been considerations affecting quality and safety of PCS CTP[13]. Ultimately, these technical considerations have contributed to limited uptake. A substudy of the Basilar Artery International Co-operation Study registry, the largest prospective dataset of PCS due to acute basilar artery occlusion, demonstrated that only 4.6% of patients underwent CTP[61]. Advances in both software and hardware have enabled whole brain coverage, thereby overcoming many of these challenges. One such advance includes the “toggling-technique” which expands coverage of limited range scanners by jogging between two location acquiring axial images in a to-and-fro manner[62,63]. Similarly, there is greater availability of multi detector scanners with wide z-axis coverage[17,60] able to image the entire brain in a single acquisition slab.
Applications in posterior circulation stroke
Several studies have demonstrated an improvement in diagnostic accuracy when CTP is combined with NCCT and CT angiography source images (CTA-SI) compared to NCCT and CTA-SI alone for the diagnosis of PCS[15,16]. Furthermore, it may hold additional prognostic information to guide acute treatment decisions including reperfusion therapy[64] and surgical intervention[65]. Indeed, a study by Becks et al.[16] reported that the incremental detection benefit of CTP added to NCCT and CTA-SI was only seen in PCS and distal stroke. Studies of early generation scanners with limited scan range demonstrated lower rates of perfusion abnormality in PCS compared to ACS[59]. In contrast, more recent studies of newer whole brain CTP have demonstrated no significant difference in the detection of PCS compared to ACS with a sensitivity of 41.4%-81.4% and specificity of 93.4%-96%[56,57].
MRI is considered the gold standard for diagnosis of PCS[66]. Its utility in the emergency setting of acute stroke is restricted by acquisition time, limited 24/7 availability and inability to be performed in patients with metal foreign bodies such as pacemakers. CTP does not face these challenges. Additionally, MRI within 24-48 h of symptoms has been reported to miss as many of 12%-20% of PCS[66-69]. Choi et al.[70] demonstrated in a cohort of PCS presenting with vertigo or dizziness and DWI MRI confirmed stroke, that 4% had a negative early DWI MRI when performed within 48 h. However, when perfusion imaging (CT or MRI) was added to clinical assessment (Head impulse, nystagmus, test of skew, plus acute hearing loss detected by finger rubbing), 100% of these early strokes missed on MRI were detected[70].
PCS due to acute basilar artery occlusion is associated with a high rate of death and disability[71]. The optimal treatment pathway for this condition has not been established[71,72]. Even in the era of endovascular thrombectomy, the rate of good functional outcome remains at ~30%[73]. The Posterior circulation Alberta stroke program early CT score (pc-ASPECTS) has been used to predict outcome after vertebrobasilar stroke[74]. Studies have demonstrated improved detection of ischaemic lesions when using CTP compared to CTA-SI alone for assessment of pc-ASPECTS[61,75]. Furthermore, CTP-based assessment demonstrated substantially better inter-rater agreement and was predictive of functional outcome[75]. This ability to accurately identify lesions and predict outcome may help to guide therapy.
PCS perfusion abnormalities vary considerably depending on the site of vascular occlusion [Figure 4A-F]. The size and distribution of the perfusion lesion are influenced by the involvement of different posterior circulation vessels including the basilar, vertebral, cerebellar or posterior cerebral arteries. It has been well established that CTP is less sensitive in detection of small volume infarcts than DWI[76]. Multiple studies have confirmed the factors associated with reduced sensitivity of PCS detection include small stroke volume and location outside of the cerebellum[56] or posterior cerebral artery territory[15]. Small brainstem strokes are not well visualised. Despite this lower sensitivity, NCCT alone is even less sensitive in detecting PCS[77]. A study by Ostman et al.[14] demonstrated that compared to non-enhanced CT, CTP improved sensitivity in detecting cerebellar lesions from 12% to 52%. This difference was even more pronounced in cerebellar lesions greater than 5 mL with sensitivity increasing from 32% to 91%.
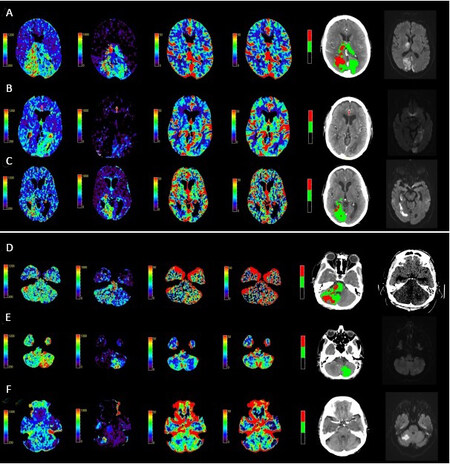
Figure 4. A spectrum of PCS perfusion patterns involving the posterior cerebral artery territory (PCA). From left to right displayed imaging includes: mean transit time, delay time, cerebral blood volume, cerebral blood flow, automated core-penumbra map and 24 h diffusion weighted MRI. Perfusion maps generated using MiStar neuroperfusion package. (A) Bilateral PCA stroke due to distal basilar artery occlusion. (B) Left PCA stroke due to a left P1 segment occlusion. (C) Right PCA territory infarction due to a right P1 segment occlusion. PCS perfusion patterns involving the cerebellar hemispheres. From left to right displayed imaging includes: mean transit time, delay time, cerebral blood volume, cerebral blood flow, automated core-penumbra map and 24 h imaging (diffusion weighted MRI or non-contrast CT brain). Perfusion maps generated using MiStar neuroperfusion package. (D) A mid basilar occlusion causing a significant brainstem and right cerebellar perfusion lesion. No visible occlusion on vessel imaging with a (E) left and (F) right posterior inferior cerebellar artery territory stroke. PCS: Posterior circulation acute ischaemic strokes.
Among the perfusion parameters, MTT[57,61], TTD[56] and TTP[57] have been most frequently reported as sensitive markers of PCS. Similarly, CBV has been shown to be a specific marker of PCS ischaemia[56,57]. To date, there have been no studies characterising the optimal perfusion threshold for ischaemic core and penumbra volume in PCS. Current proprietary automated core and penumbra maps are based on thresholds derived from anterior circulation stroke[17,32,34,38,41,44]. As such, caution should be applied to automated estimates of core and penumbra in PCS until these thresholds are validated. It is prudent for clinicians to inspect the raw perfusion maps as lesions may be apparent at subthreshold levels [Figure 1I-K, Figure 2I-L].
Future directions
CTP has been integral to studies of acute therapies over the extended time window[3,4,6,7]. Ma et al.[4] used CTP-based criteria to select patients who benefit from thrombolysis up to 9 h after stroke onset. Further randomised control trials are underway exploring even later window thrombolysis utilising CTP-based selection criteria [Tenecteplase in Stroke Patients Between 4.5 and 24 h (TIMELESS), NCT03785678 and Extending the time window for Tenecteplase by Effective Reperfusion of peNumbrAL tissue in patients with Large Vessel Occlusion (ETERNAL), NCT04454788]. Unfortunately, these studies have been limited to patients with acute hemispheric infarction. Given the promising diagnostic applications of CTP for PCS, future trials of acute therapy using CTP based selection may be warranted.
CONCLUSION
CTP performed for suspected PCS facilitates important diagnostic and prognostic information and can be rapidly acquired in the emergency setting. Historically, uptake in suspected PCS has been poor due to technical challenges. With the wider availability of scanners capable of whole brain coverage and strategies to reduce radiation exposure, routine CTP in all patients with suspected acute PCS may be worthwhile. However, at present perfusion thresholds are not validated for PCS, and expert assessment of raw perfusion maps is advised.
DECLARATIONS
Authors’ contributionsThe principal author of the manuscript: Edwards LS
Drafting and revision of the manuscript: Cappelen-Smith C, Cordato D, Bivard A, Churilov L
Conception, drafting and revision of the manuscript: Parsons MW
Availability of data and materialsNot applicable.
Financial support and sponsorshipNone.
Conflicts of interestAll authors declared that there are no conflicts of interest.
Ethical approval and consent to participateNot applicable.
Consent for publicationNot applicable.
Copyright© The Author(s) 2021
REFERENCES
1. Powers WJ, Rabinstein AA, Ackerson T, et al. Guidelines for the early management of patients with acute ischemic stroke: 2019 update to the 2018 guidelines for the early management of acute ischemic stroke: a guideline for healthcare professionals from the American heart association/American stroke association. Stroke 2019;50:e344-418.
2. National Stroke Foundation (Australia). Clinical guidelines for stroke management 2010. Available from: https://www.academia.edu/32407966/Clinical_Guidelines_for_Stroke_Management_2010_National_Stroke_Foundation [Last accessed on 4 Jun 2021].
3. Rai AT, Seldon AE, Boo S, et al. A population-based incidence of acute large vessel occlusions and thrombectomy eligible patients indicates significant potential for growth of endovascular stroke therapy in the USA. J Neurointerv Surg 2017;9:722-6.
4. Ma H, Campbell BCV, Parsons MW, et al. Thrombolysis guided by perfusion imaging up to 9 hours after onset of stroke. N Engl J Med 2019;380:1795-803.
5. Thomalla G, Simonsen CZ, Boutitie F, et al. MRI-guided thrombolysis for stroke with unknown time of onset. N Engl J Med 2018;379:611-22.
6. Nogueira RG, Jadhav AP, Haussen DC, et al. Thrombectomy 6 to 24 hours after stroke with a mismatch between deficit and infarct. N Engl J Med 2018;378:11-21.
7. Albers GW, Marks MP, Kemp S, et al. Thrombectomy for stroke at 6 to 16 hours with selection by perfusion imaging. N Engl J Med 2018;378:708-18.
8. Bamford J, Sandercock P, Dennis M, Burn J, Warlow C. Classification and natural history of clinically identifiable subtypes of cerebral infarction. Lancet 1991;337:1521-6.
9. Schulz UG, Fischer U. Posterior circulation cerebrovascular syndromes: diagnosis and management. J Neurol Neurosurg Psychiatry 2017;88:45-53.
10. Tarnutzer AA, Lee SH, Robinson KA, Wang Z, Edlow JA, Newman-Toker DE. ED misdiagnosis of cerebrovascular events in the era of modern neuroimaging: a meta-analysis. Neurology 2017;88:1468-77.
11. Arch AE, Weisman DC, Coca S, Nystrom KV, Wira CR 3rd, Schindler JL. Missed ischemic stroke diagnosis in the emergency department by emergency medicine and neurology services. Stroke 2016;47:668-73.
12. Paul NL, Simoni M, Rothwell PM. Oxford Vascular Study. Transient isolated brainstem symptoms preceding posterior circulation stroke: a population-based study. Lancet Neurol 2013;12:65-71.
13. Wintermark M, Fischbein NJ, Smith WS, Ko NU, Quist M, Dillon WP. Accuracy of dynamic perfusion CT with deconvolution in detecting acute hemispheric stroke. AJNR Am J Neuroradiol 2005;26:104-12.
14. Ostman C, Garcia-Esperon C, Lillicrap T, et al. Multimodal computed tomography increases the detection of posterior fossa strokes compared to brain non-contrast computed tomography. Front Neurol 2020;11:588064.
15. van der Hoeven EJ, Dankbaar JW, Algra A, et al. Additional diagnostic value of computed tomography perfusion for detection of acute ischemic stroke in the posterior circulation. Stroke 2015;46:1113-5.
16. Becks MJ, Manniesing R, Vister J, et al. Brain CT perfusion improves intracranial vessel occlusion detection on CT angiography. J Neuroradiol 2019;46:124-9.
17. Lin L, Bivard A, Krishnamurthy V, Levi CR, Parsons MW. Whole-brain CT perfusion to quantify acute ischemic penumbra and core. Radiology 2016;279:876-87.
18. Demeestere J, Wouters A, Christensen S, Lemmens R, Lansberg MG. Review of perfusion imaging in acute ischemic stroke: from time to tissue. Stroke 2020;51:1017-24.
19. Christensen S, Lansberg MG. CT perfusion in acute stroke: practical guidance for implementation in clinical practice. J Cereb Blood Flow Metab 2019;39:1664-8.
20. Bivard A, Levi C, Spratt N, Parsons M. Perfusion CT in acute stroke: a comprehensive analysis of infarct and penumbra. Radiology 2013;267:543-50.
21. Kudo K, Sasaki M, Yamada K, et al. Differences in CT perfusion maps generated by different commercial software: quantitative analysis by using identical source data of acute stroke patients. Radiology 2010;254:200-9.
22. Chen C, Bivard A, Lin L, Levi CR, Spratt NJ, Parsons MW. Thresholds for infarction vary between gray matter and white matter in acute ischemic stroke: a CT perfusion study. J Cereb Blood Flow Metab 2019;39:536-46.
23. Wintermark M, Maeder P, Thiran JP, Schnyder P, Meuli R. Quantitative assessment of regional cerebral blood flows by perfusion CT studies at low injection rates: a critical review of the underlying theoretical models. Eur Radiol 2001;11:1220-30.
24. Garcia-Esperon C, Spratt NJ, Gangadharan S, et al. Computed tomography perfusion identifies patients with stroke with impaired cardiac function. Stroke 2020;51:498-503.
25. Schumann P, Touzani O, Young AR, Morello R, Baron JC, MacKenzie ET. Evaluation of the ratio of cerebral blood flow to cerebral blood volume as an index of local cerebral perfusion pressure. Brain 1998;121:1369-79.
26. Vagal A, Wintermark M, Nael K, et al. Automated CT perfusion imaging for acute ischemic stroke: Pearls and pitfalls for real-world use. Neurology 2019;93:888-98.
27. Wouters A, Christensen S, Straka M, et al. A comparison of relative time to peak and tmax for mismatch-based patient selection. Front Neurol 2017;8:539.
28. Reichenbach JR, Röther J, Jonetz-Mentzel L, et al. Acute stroke evaluated by time-to-peak mapping during initial and early follow-up perfusion CT studies. Am J Neuroradiol 1999;20:1842-50.
29. Meagher R, Shankar JJ. CT Perfusion in acute stroke: “Black Holes” on time-to-peak image maps indicate unsalvageable brain. J Neuroimaging 2019;26:605-11.
30. Lin L, Bivard A, Kleinig T, et al. Correction for delay and dispersion results in more accurate cerebral blood flow ischemic core measurement in acute stroke. Stroke 2018;49:924-30.
31. Calamante F, Gadian DG, Connelly A. Delay and dispersion effects in dynamic susceptibility contrast MRI: simulations using singular value decomposition. Magn Reson Med 2000;44:466-73.
32. Campbell BC, Christensen S, Levi CR, et al. Comparison of computed tomography perfusion and magnetic resonance imaging perfusion-diffusion mismatch in ischemic stroke. Stroke 2012;43:2648-53.
33. Campbell BC, Parsons MW. Parsons. Imaging selection for acute stroke intervention. Int J Stroke 2018;13:554-67.
34. Yu Y, Han Q, Ding X, et al. Defining core and penumbra in ischemic stroke: a voxel- and volume-based analysis of whole brain CT perfusion. Sci Rep 2016;6:20932.
35. Thierfelder KM, Sommer WH, Baumann AB, et al. Whole-brain CT perfusion: reliability and reproducibility of volumetric perfusion deficit assessment in patients with acute ischemic stroke. Neuroradiology 2013;55:827-35.
36. Yoo AJ, Verduzco LA, Schaefer PW, Hirsch JA, Rabinov JD, González RG. MRI-based selection for intra-arterial stroke therapy: value of pretreatment diffusion-weighted imaging lesion volume in selecting patients with acute stroke who will benefit from early recanalization. Stroke 2009;40:2046-54.
37. Thomalla G, Hartmann F, Juettler E, et al. Prediction of malignant middle cerebral artery infarction by magnetic resonance imaging within 6 hours of symptom onset: a prospective multicenter observational study. Ann Neurol 2010;68:435-45.
38. Wintermark M, Flanders AE, Velthuis B, et al. Perfusion-CT assessment of infarct core and penumbra: receiver operating characteristic curve analysis in 130 patients suspected of acute hemispheric stroke. Stroke 2006;37:979-85.
39. Bivard A, Spratt N, Levi C, Parsons M. Perfusion computer tomography: imaging and clinical validation in acute ischaemic stroke. Brain 2011;134:3408-16.
40. Cereda CW, Christensen S, Campbell BCV, et al. A benchmarking tool to evaluate computer tomography perfusion infarct core predictions against a DWI standard. J Cereb Blood Flow Metab 2016;36:1780-9.
41. Mintorovitch J, Yang GY, Shimizu H, Kucharczyk J, Chan PH, Weinstein PR. Diffusion-weighted magnetic resonance imaging of acute focal cerebral ischemia: comparison of signal intensity with changes in brain water and Na+,K(+)-ATPase activity. J Cereb Blood Flow Metab 1994;14:332-6.
42. Boned S, Padroni M, Rubiera M, et al. Admission CT perfusion may overestimate initial infarct core: the ghost infarct core concept. J Neurointerv Surg 2017;9:66-9.
43. d'Esterre CD, Boesen ME, Ahn SH, et al. Time-dependent computed tomographic perfusion thresholds for patients with acute ischemic stroke. Stroke 2015;46:3390-7.
44. Murphy BD, Fox AJ, Lee DH, et al. Identification of penumbra and infarct in acute ischemic stroke using computed tomography perfusion-derived blood flow and blood volume measurements. Stroke 2006;37:1771-7.
45. Straka M, Albers GW, Bammer R. Real-time diffusion-perfusion mismatch analysis in acute stroke. J Magn Reson Imaging 2010;32:1024-37.
46. Kealey SM, Loving VA, Delong DM, Eastwood JD. User-defined vascular input function curves: influence on mean perfusion parameter values and signal-to-noise ratio. Radiology 2004;231:587-93.
47. der Schaaf I, Vonken EJ, Waaijer A, Velthuis B, Quist M, van Osch T. Influence of partial volume on venous output and arterial input function. Am J Neuroradiol 2006;27:46-50.
48. Campbell BC, Yassi N, Ma H, et al. Imaging selection in ischemic stroke: feasibility of automated CT-perfusion analysis. Int J Stroke 2015;10:51-4.
49. Fahmi F, Marquering HA, Borst J, et al. 3D movement correction of CT brain perfusion image data of patients with acute ischemic stroke. Neuroradiology 2014;56:445-52.
50. Tong E, Wintermark M. CTA-enhanced perfusion CT: an original method to perform ultra-low-dose CTA-enhanced perfusion CT. Neuroradiology 2014;56:955-64.
51. Diekmann S, Siebert E, Juran R, et al. Dose exposure of patients undergoing comprehensive stroke imaging by multidetector-row CT: comparison of 320-detector row and 64-detector row CT scanners. AJNR Am J Neuroradiol 2010;31:1003-9.
52. Heit JJ, Wintermark M. Perfusion computed tomography for the evaluation of acute ischemic stroke: strengths and pitfalls. Stroke 2016;47:1153-8.
53. Raman SP, Mahesh M, Blasko RV, Fishman EK. CT scan parameters and radiation dose: practical advice for radiologists. J Am Coll Radiol 2013;10:840-6.
54. Rogalla P, Kloeters C, Hein PA. CT technology overview: 64-slice and beyond. Radiol Clin North Am 2009;47:1-11.
55. Campbell BC, Weir L, Desmond PM, et al. CT perfusion improves diagnostic accuracy and confidence in acute ischaemic stroke. J Neurol Neurosurg Psychiatry 2013;84:613-8.
56. Bollwein C, Plate A, Sommer WH, et al. Diagnostic accuracy of whole-brain CT perfusion in the detection of acute infratentorial infarctions. Neuroradiology 2016;58:1077-85.
57. Lee IH, You JH, Lee JY, et al. Accuracy of the detection of infratentorial stroke lesions using perfusion CT: an experimenter-blinded study. Neuroradiology 2010;52:1095-100.
58. Ogasawara K, Sasaki M, Tomitsuka N, Kubo Y, Inoue T, Ogawa A. Early revascularization in a patient with perfusion computed tomography/diffusion-weighted magnetic resonance imaging mismatch secondary to acute vertebral artery occlusion. Case report. Neurol Med Chir (Tokyo) 2005;45:306-10.
59. Bill O, Inácio NM, Lambrou D, et al. Focal hypoperfusion in acute ischemic stroke perfusion CT: clinical and radiologic predictors and accuracy for infarct prediction. AJNR Am J Neuroradiol 2019;40:483-9.
60. Page M, Nandurkar D, Crossett MP, et al. Comparison of 4 cm Z-axis and 16 cm Z-axis multidetector CT perfusion. Eur Radiol 2010;20:1508-14.
61. Pallesen LP, Gerber J, Dzialowski I, et al. Diagnostic and prognostic impact of pc-ASPECTS applied to perfusion CT in the Basilar Artery International Cooperation Study. J Neuroimaging 2015;25:384-9.
62. Wintermark M, Smith WS, Ko NU, Quist M, Schnyder P, Dillon WP. Dynamic perfusion CT: optimizing the temporal resolution and contrast volume for calculation of perfusion CT parameters in stroke patients. AJNR Am J Neuroradiol 2004;25:720-9.
63. Youn SW, Kim JH, Weon YC, Kim SH, Han MK, Bae HJ. Perfusion CT of the brain using 40-mm-wide detector and toggling table technique for initial imaging of acute stroke. AJR Am J Roentgenol 2008;191:W120-6.
64. Fabritius MP, Reidler P, Froelich MF, et al. Incremental value of computed tomography perfusion for final infarct prediction in acute ischemic cerebellar stroke. J Am Heart Assoc 2019;8:e013069.
65. Fabritius MP, Thierfelder KM, Meinel FG, et al. Early imaging prediction of malignant cerebellar edema development in acute ischemic stroke. Stroke 2017;48:2597-600.
66. Muir KW, Buchan A, von Kummer R, Rother J, Baron JC. Imaging of acute stroke. Lancet Neurol 2006;5:755-68.
67. Kattah JC, Talkad AV, Wang DZ, Hsieh YH, Newman-Toker DE. HINTS to diagnose stroke in the acute vestibular syndrome: three-step bedside oculomotor examination more sensitive than early MRI diffusion-weighted imaging. Stroke 2009;40:3504-10.
68. Oppenheim C, Stanescu R, Dormont D, et al. False-negative diffusion-weighted MR findings in acute ischemic stroke. AJNR Am J Neuroradiol 2000;21:1434-40.
69. Chalela JA, Kidwell CS, Nentwich LM, et al. Magnetic resonance imaging and computed tomography in emergency assessment of patients with suspected acute stroke: a prospective comparison. Lancet 2007;369:293-8.
70. Choi JH, Oh EH, Park MG, et al. Early MRI-negative posterior circulation stroke presenting as acute dizziness. J Neurol 2018;265:2993-3000.
71. Schonewille W, Wijman C, Michel P. BASICS investigators. Treatment and clinical outcome in patients with basilar artery occlusion. Stroke 2006;37:2206-7.
72. Schonewille WJ, Wijman CA, Michel P, et al. Treatment and outcomes of acute basilar artery occlusion in the Basilar Artery International Cooperation Study (BASICS): a prospective registry study. Lancet Neurol 2009;8:724-30.
73. Ravindren J, Aguilar Pérez M, Hellstern V, Bhogal P, Bäzner H, Henkes H. Predictors of outcome after endovascular thrombectomy in acute basilar artery occlusion and the 6hr time window to recanalization. Front Neurol 2019;10:923.
74. Puetz V, Khomenko A, Hill MD, et al. Basilar Artery International Cooperation Study (BASICS) Group. Extent of hypoattenuation on CT angiography source images in basilar artery occlusion: prognostic value in the Basilar Artery International Cooperation Study. Stroke 2011;42:3454-9.
75. Alemseged F, Shah DG, Bivard A, et al. Cerebral blood volume lesion extent predicts functional outcome in patients with vertebral and basilar artery occlusion. Int J Stroke 2019;14:540-7.
76. Biesbroek JM, Niesten JM, Dankbaar JW, et al. Diagnostic accuracy of CT perfusion imaging for detecting acute ischemic stroke: a systematic review and meta-analysis. Cerebrovasc Dis 2013;35:493-501.
Cite This Article
Export citation file: BibTeX | RIS
OAE Style
Edwards LS, Cappelen-Smith C, Cordato D, Bivard A, Churilov L, Parsons MW. Review of CT perfusion and current applications in posterior circulation stroke. Vessel Plus 2021;5:42. http://dx.doi.org/10.20517/2574-1209.2021.18
AMA Style
Edwards LS, Cappelen-Smith C, Cordato D, Bivard A, Churilov L, Parsons MW. Review of CT perfusion and current applications in posterior circulation stroke. Vessel Plus. 2021; 5: 42. http://dx.doi.org/10.20517/2574-1209.2021.18
Chicago/Turabian Style
Edwards, Leon S., Cecilia Cappelen-Smith, Dennis Cordato, Andrew Bivard, Leonid Churilov, Mark W. Parsons. 2021. "Review of CT perfusion and current applications in posterior circulation stroke" Vessel Plus. 5: 42. http://dx.doi.org/10.20517/2574-1209.2021.18
ACS Style
Edwards, LS.; Cappelen-Smith C.; Cordato D.; Bivard A.; Churilov L.; Parsons MW. Review of CT perfusion and current applications in posterior circulation stroke. Vessel Plus. 2021, 5, 42. http://dx.doi.org/10.20517/2574-1209.2021.18
About This Article
Special Issue
Copyright

Data & Comments
Data


 Cite This Article 25 clicks

 Like This Article 10
likes
Like This Article 10
likes


Comments
Comments must be written in English. Spam, offensive content, impersonation, and private information will not be permitted. If any comment is reported and identified as inappropriate content by OAE staff, the comment will be removed without notice. If you have any queries or need any help, please contact us at support@oaepublish.com.