
Assessment of agreement of two high sensitivity troponin assays during an institutional transition
 0
0Abstract
Aim: During a recent institutional transition between two high sensitivity troponin assays, we sought to evaluate the correlation and agreement in an unselected population presenting to the ED undergoing troponin measurement.
Methods: This was a prospective study of consecutive patients presenting to a single, academic institution that underwent troponin testing. Paired samples of two high sensitivity troponin assays, hs-cTnT (Gen 5 TnT; Roche Diagnostics, Indianapolis, IN) and hs-cTnI (High Sensitive Troponin I Architect i2000; Abbott, Abbott Park, Illinois) were assessed for overall correlation and agreement. We also evaluated the paired difference between the two assays stratified by gender and CKD stage. Further, we determined reclassification at the 99th percentile limit and the institutional established abnormal.
Results: A total of 1349 unique patient encounters were included in the study with median result value of 12.2 ng/L (IQR 6-29.5) for hs-cTnT and 4.7 ng/L (IQR 3.5-15.5) for hs-cTnI. Direct comparison of the two assays indicated a Spearman Rho of 0.79 with poor agreement especially when cTn results were elevated. Paired difference was smaller in women with a difference of medians of 0.9 ng/L (0.06-1.67, P < 0.01) and three significant clusters (CKD 1, CKD 2 and 3, CKD 4 and 5; P < 0.01) were found when stratifying by Chronic Kidney Disease stage Reclassification occurred in 276 patients when evaluated at the 99th percentile and 148 patients at the institution’s abnormal cut-off.
Conclusion: There was moderate correlation seen during our transition between the two high sensitivity troponins, but differential bias with lower hs-cTnI than hs-cTnT at low levels and higher hs-cTnI than hs-cTnT at high values. Without the appropriate system level recommendations and established diagnostic protocol this level of disagreement can potentially cause problems with interpretation to the end clinician who has become accustomed to a specific assay’s thresholds.
Keywords
INTRODUCTION
With the increased adoption of high sensitivity troponin (hs-cTn) testing, and regulatory approval of multiple hs-cTn assays, identification of an optimal troponin assay for use in an emergency department (ED) has become more challenging. Currently, there is high variability in the assay choices and algorithms for use in diagnostic pathways across institutions[1]. As newer assays become available, transition between hs-cTn assays will become more common.
Few direct comparisons of hs-cTnI with hs-cTnT in a general ED populations have been reported. In healthy populations, 99th percentile thresholds vary modestly between different hs-cTnI assays and the hs-cTnT assay[2-4]. An ED patient population would include higher risk patients with various co-morbidities known to impact troponin levels, such as chronic kidney disease, which may result in greater variability among assays. Previously, several studies performed in ED populations suggested that while there is correlation between the hs-cTnI and hs-cTnT assays, there does not appear to be a uniquely linear relationship[5,6].
Due to the full automation requirements of the core lab, our institution necessitated a transition from hs-cTnT (Gen 5 TnT; Roche Diagnostics, Indianapolis, IN) to hs-cTnI (High Sensitive Troponin I Architect i2000; Abbott, Abbott Park, Illinois) offering us an opportunity to evaluate the correlation between these assays in an unselected population presenting to the ED and undergoing troponin measurement. We further assessed correlations in subgroups with specific features known to affect troponin assay results. In addition, we aimed to evaluate reclassification of patients at actionable thresholds of the two assays to assess operational impact this transition may have for interpretation during an ED visit.
METHODS
Consecutive patients 18 years of age or older presenting to the ED of a single, urban, academic quaternary care facility between May and September 2020 and undergoing troponin measurement were included for study during a planned transition from hs-cTnT to hs-cTnI. For each troponin order placed during the emergency department evaluation, paired samples were collected for comparative analysis. If serial testing was performed, the maximum hs-cTnT result and its corresponding paired hs-cTnI were included for analysis. Additional associated data were extracted from the health system’s electronic data warehouse which included demographic data, gender, known comorbidities, and renal function. Comorbidities were extracted from registries that automatically populate within the EHR when a diagnosis or a problem list is updated with a diagnosis associated with a specific Systematized Nomenclature of Medicine (SNOMED) concept, a universal medical terminology system[7]. Estimated glomerular filtration rate (eGFR) was calculated from MDRD equation[8] and then classified within the appropriate level of chronic kidney disease (CKD). This study was exempted by institutional IRB.
Measures
This descriptive study assessed the correlation and agreement of hs-cTnT and hs-cTnI overall. We also assessed the paired difference between the two assays stratified by gender and CKD level. Further, we determined reclassification at the 99th percentile upper reference limit defined at 19 ng/L for hs-cTnT and 26 ng/L for hs-cTnI and the institutional abnormal cut-off within our diagnostic protocol, 52 ng/L.
Data analysis
Demographic data were presented as mean (SD) and count data presented with associated percentages. Troponin results were presented with median (IQR) given non-normal distributions. Correlations between hs-cTnT and hs-cTnI were determined using Spearman’s rank correlation coefficient and presented on a log-log scale. Linear regression was performed by regressing hs-cTnI on hs-cTnT after logarithmic transformation of both and evaluation of the model fit was performed utilizing ANOVA testing and assessment of coefficient of determination. Weighted least square was utilized given the nonconstant variance appreciated during residual analysis. Bland-Altman plot was utilized to assess agreement between both assays and reported with mean paired difference and associated standard deviation with mean and upper and lower level of agreement represented graphically[9,10].
Paired differences between both assays were calculated and were compared between across strata of both gender and CKD utilizing Wilcoxon rank-sum test. Pairwise Wilcoxon rank-sum method was utilized when levels of categorical variables compared were greater than two, utilizing Holm’s continuity correction to control the family-wise error rate. Lastly, comparison of specimen reclassification at 99% of abnormal and institution abnormal threshold was presented in count and percentages.
RESULTS
One thousand five hundred seventy-two unique encounters were initially included in our study. After removing 200 encounters due to repeat visits during the study period and 23 encounters due to no associated diagnosis, demographic or lab data, 1349 unique patient-encounters were included in the analysis [55% women, mean age 57 (SD 18) years]. Of the 1349 encounters, 51 had an associated diagnosis classified as a MACE with 20 of those attributed to a non-ST Segment elevation MI (NSTEMI). Additional demographic and population level data can be seen in Table 1. Median result value for the study cohort was 12.2 ng/L (IQR 6-29.5) for hs-cTnT compared with 4.7 ng/L (IQR 3.5-15.5) for hs-cTnI with difference of medians of 5.1 (95%CI: 4.7-5.6, P < 0.01) between the two assays overall with their median pairwise difference 3.8 ng/L (IQR 2.5-10.2) [Table 2].
Patient cohort characteristics
| N = 1349 | |
| AGE | 57 (IQR 39-75) |
| Women | 745 (55%) |
| Race | |
| American Indian | 4 (< 1%) |
| Asian | 27 (2%) |
| Black or African American | 434 (32%) |
| White | 712 (53%) |
| Other/Unknown | 172 (13%) |
| Ethnicity | |
| Hispanic or Latino | 272 (20%) |
| Non-Hispanic/Latino | 1053 (78%) |
| Other/Unknown | 24 (2%) |
| Comorbid conditions present | |
| Hypertension | 505 (37%) |
| Diabetes | 254 (19%) |
| Heart failure | 178 (13%) |
| Coronary artery disease | 200 (15%) |
| Atrial fibrillation | 144 (11%) |
Comparison of hs-cTnI and hs-cTnT results within the patient cohort and stratified by subgroup. Assessment of pairwise difference performed compared across various strata
| N | hs-cTnI | hs-cTnT | Median pairwise difference | |
| All Patients | 1349 | 4.7 (3.5-15.5) | 12.2 (6.0-29.8) | 3.8 (2.5-10.2) |
| Sex | ||||
| Female | 745 | 3.6 (3.5-12.0) | 9.9 (6.0-24.0) | 2.65 (2.5-8.5) |
| Male | 604 | 6.1 (3.5-22.7) | 15.8 (8.5-38.0) | 5.0 (2.5-12.6) |
| Chronic kidney disease | ||||
| Stage 1 | 1018 | 3.5 (3.5-9.0) | 9.18 (6.0-17.3) | 2.66 (2.5-7.2) |
| Stage 2 | 122 | 9 (3.5-26.6) | 23.8 (13.7-37.2) | 7.76 (3.1-15.5) |
| Stage 3 | 76 | 18.6 (6.5-47.5) | 40.9 (24.0-74.0) | 12.5 (-3.3-27.7) |
| Stage 4 | 74 | 21.7 (11.8-48.7) | 86.2 (36.0-128.0) | 31.6 (8.1-74.6) |
| Stage 5 | 59 | 36.1 (22.8-89.2) | 95.8 (61.9-168.0) | 44.5 (10.6-105.0) |
Hs-cTnT and hs-cTnI were correlated with a Spearman Rho of 0.79. Scatter plot and residual analysis suggest that there is a log-linear relationship. After logarithmic transformation of both hs-cTnT and hs-cTnI, regressing log10 hs-cTnI on log10 hs-cTnT found a linear relationship represented in Figure 1. A significant regression equation was found [F (1,1347) = 1137, P < 0.001] predicting an increase of 0.86% in hs-cTnI for every 1% increase in hs-cTnT. Despite a statistically significant model fit, R2 was found to be only 0.46. Inclusion of gender or CKD stage offered minimal improvement on overall R2.
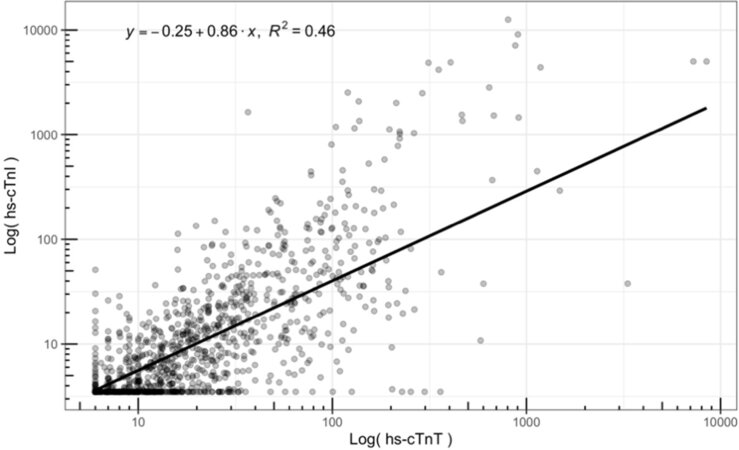
Figure 1. Logarithmic transformed plot of hs-cTnT vs. hs-cTnI with associated log-linear fit with equation: log10(hs-cTnI) = -0.25 + 0.86 × log10(hs-cTnT).
The Bland-Altman plot showed with a mean paired difference of -32 (SD 529) [Figure 2]. Assessment of agreement found a proportional bias with lower hs-cTnI compared to hs-cTnT at the lower range of values but much higher hs-cTnI with respect to hs-cTnT when results are on the upper end of the spectrum.
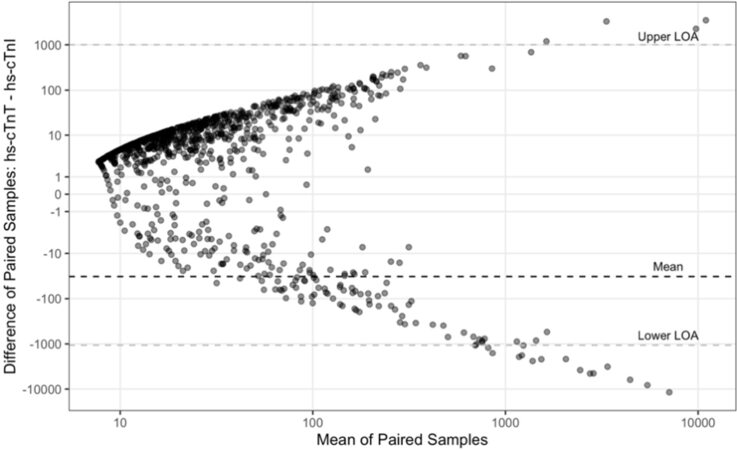
Figure 2. Bland Altman plot comparing mean of paired samples to paired difference (hs-cTnT-hs-cTnI).
Paired difference between the two assays was found to be smaller in women with a difference of medians of 0.9 ng/L (0.06-1.67, P < 0.01) compared with men, suggesting a slightly lower hs-cTnI value with respect to hs-cTnT for women. When assessing the paired difference stratified across 5 CKD stages, we found significant clusters separating into 3 groups: Stage 1, Stage 2/3, and Stage 4/5 (P < 0.01) with rising values of hs-cTnT with respect to hs-cTnI as the CKD progressed [Figure 3].
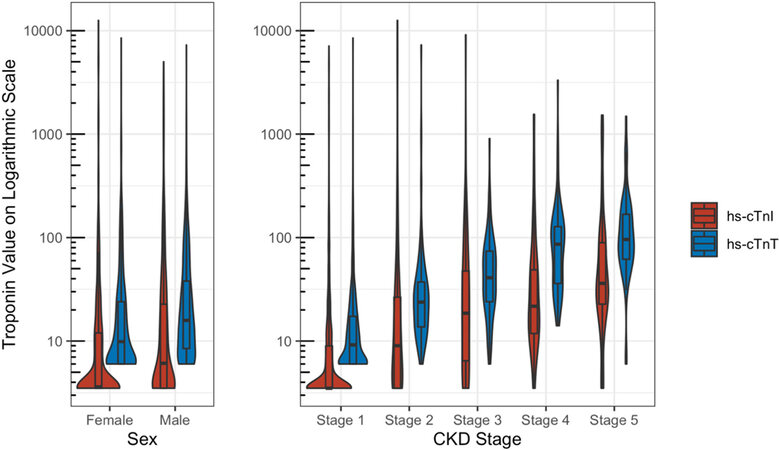
Figure 3. Distributions of patients evaluating difference in hs-cTn result stratified by Sex and CKD Stage.
Specimen reclassification at the 99th percentile value occurred in 276 (26%) patients being evaluated with 264 (19%) of those being classified as abnormal by hs-cTnT but not by hs-cTnI. When evaluating at the institutional abnormal threshold of 52 ng/L for both hs-cTnT and hs-cTnI, 148 (12%) patients would have been reclassified with 116 (9%) abnormal when using hs-cTnT but not hs-cTnI. Reclassification distributions can be seen in Table 3.
Specimen reclassification
| 99th percentile n (%) | Institution abnormal threshold n (%) | |
| Both normal | 845 (63%) | 1096 (81%) |
| Both abnormal | 228 (17%) | 105 (8%) |
| hs-cTnT abnormal/ hs-cTnI normal | 264 (19%) | 116 (9%) |
| hs-cTnT normal/ hs-cTnI abnormal | 12 (1%) | 32 (2%) |
DISCUSSION
Our evaluation of paired samples of two different high sensitivity troponin assays during an institutional transition found correlation of both hs-cTnT with hs-cTnI (Spearman’s Rho 0.79) with a log-linear relationship between the two assays. Despite a significant linear fit, the coefficient of determination was low (0.46), suggesting a large percentage of the overall variance of the hs-cTnI result is not well predicted by the value of hs-cTnT. This is visually evident as well in Figure 1. When values are low the correlation appears much stronger, but as values increase, there is a noticeable increase in the variance from the fitted line. Multiple other studies have found a similar level of correlation when evaluating different populations with Pearson’s r ranging between 0.6 and 0.7[2,11]. While classically this corresponds to a moderate or better level of agreement, the small change values and low cutoffs used clinically suggest that differences in measurements significantly affect interpretation even at this level.
This relation is better appreciated on the Bland-Altman plot suggesting that despite the linear correlation found, there is poor agreement between these two assays with a wide range between limits of agreement
Even at lower levels there appears to be lack of agreement evidenced when evaluating the reclassification at the 99th percentile and our institution’s established abnormal value. We found potentially clinically meaningful reclassification in 148 (10.9%) patients with 116 of these (8.6%) classified as abnormal by the hs-cTnT assay who would not be considered abnormal by the hs-cTnI assay. This reflects the observed bias towards lower hs-cTnI than hs-cTnT at lower troponin concentrations that are near clinical decision limits. This would result in substantial reclassification of patients to “rule out” MI with hs-cTnI compared with hs-cTnT. While MI was uncommon in this cohort, precluding assessment of the relation between reclassification and outcomes, the high proportion of patients that were reclassified is notable and suggests that transitioning between various assays is not just a “plug and play” option. The clinical implications of bias towards higher hs-cTnI than hs-cTnT at high troponin concentrations are less clear. This may have little impact on emergency department practice as this bias occurs at markedly abnormal troponin levels where triage to discharge is unlikely; however, it may have important implications for interpretation in hospitalized patients, who may have hs-cTnI levels that are markedly higher than hs-cTnT. Further work should investigate whether the reclassification between two high sensitivity troponins and the discordance at the higher spectrum results in outcome differences.
Subgroup analysis found minimal differences with respect to sex. Women had lower median troponin levels than men for both hs-cTnI and hs-cTnT with a statistically significant paired difference (0.9 ng/L). This difference by sex has been previously reported with larger differences for females than we have seen in our data[12]. On the other hand, CKD may contribute to some of discordance seen in our sample where a significant increase in the difference between cTn levels was appreciated with increasing hs-cTnT compared to hs-cTnI with increasing CKD severity. Prior literature also supports this finding with higher levels of cTnT than cTnI in patients with ESRD[13,14]. This difference between assays in the setting of CKD has been seen in other populations as well[15]. When included in modeling, neither CKD stage nor sex had a significant impact on the proportion of variance explained in hs-cTnI result. Prior literature has supported other pathologies which can attribute to a discordance in cTnT compared to cTnT such as various myopathies[16], though the prevalence of these pathologies cannot attribute to the volume of discordant results we have seen.
Our data raise concerns that transitioning from Roche’s hs-cTnT assay to Abbott’s hs-cTnI may prove challenging due to poor agreement at levels that can affect clinical decision making. Future work should investigate which features may affect discordance. Given the discordance in values, we would additionally recommend when operationalizing a transition between two unique troponin assays to include a period of overlap to provide clinicians additional information in situations where interpretability of one assay is affected.
Limitations
This was a prospective collection of sequential ED patients in whom troponin testing occurred. During this time period, the ongoing COVID-19 pandemic may have altered the composition of our patient population and may have led to more troponin testing than is typical.
Additionally, while not the focus of our study, the rate of MI and MACE in the population studied here was low possibly also reflecting the timing of the study period. This could explain why the concordance seen here is similar to that reported in healthier cohorts compared to those with acute events[17].
In conclusion, there was moderate correlation seen during our transition between the two high sensitivity troponins, but differential bias with lower hs-cTnI than hs-cTnT at low levels and higher hs-cTnT than hs-cTnT at high values. Without the appropriate system level recommendations and established diagnostic protocols, or a sophisticated, automated method for interpretation, this level of disagreement can potentially cause problems with interpretation to the end clinician who have become accustomed to a specific assay’s thresholds.
DECLARATIONS
AcknowledgmentsAuthors’ contributionsInvolved in animal breeding, conducted experiments, and analyzed data: Iffiú-Soltész Z
Availability of data and materialsMice generated and provided by the group of Pr. S. Jalkanen and M. Salmi are available under MTA with their founders.
Financial support and sponsorshipThis work was supported by recurrent INSERM grants for the UMR1048 and partially by the French-Hungarian collaborative programme Balaton.
Conflicts of interestAll authors declared that there are no conflicts of interest.
Ethical approval and consent to participateStudy protocol was submitted to UT Southwestern’s Institutional Review Board and was deemed exempt due to the retrospective nature of the work.
Consent for publicationNot applicable.
Copyright© The author(s) 2021.
REFERENCES
1. Levy PD, Mahler SA. Evaluating suspected acute MI in the emergency department: what is and what should never be. J Am Coll Cardiol 2019;74:495-7.
2. Kimenai DM, Henry RM, van der Kallen CJ, et al. Direct comparison of clinical decision limits for cardiac troponin T and I. Heart 2016;102:610-6.
3. Giannitsis E, Mueller-Hennessen M, Zeller T, et al. Gender-specific reference values for high-sensitivity cardiac troponin T and I in well-phenotyped healthy individuals and validity of high-sensitivity assay designation. Clin Biochem 2020;78:18-24.
4. Apple FS, Wu AHB, Sandoval Y, et al. Sex-specific 99th percentile upper reference limits for high sensitivity cardiac troponin assays derived using a universal sample bank. Clin Chem 2020;66:434-44.
5. Lippi G, Cervellin G, Aloe R, Montagnana M, Salvagno GL, Guidi GC. Non-commutability of results of highly sensitive troponin I and T immunoassays. Biochem Med (Zagreb) 2012;22:127-9.
6. van der Linden N, Wildi K, Twerenbold R, et al. Combining high-sensitivity cardiac troponin I and cardiac troponin T in the early diagnosis of acute myocardial infarction. Circulation 2018;138:989-99.
7. Willett DL, Kannan V, Chu L, et al. SNOMED CT concept hierarchies for sharing definitions of clinical conditions using electronic health record data. Appl Clin Inform 2018;9:667-82.
8. Levey AS, Bosch JP, Lewis JB, Greene T, Rogers N, Roth D. A more accurate method to estimate glomerular filtration rate from serum creatinine: a new prediction equation. Modification of Diet in Renal Disease Study Group. Ann Intern Med 1999;130:461-70.
9. Euser AM, Dekker FW, le Cessie S. A practical approach to Bland-Altman plots and variation coefficients for log transformed variables. J Clin Epidemiol 2008;61:978-82.
10. Bland JM, Altman DG. Statistical methods for assessing agreement between two methods of clinical measurement. Lancet 1986;1:307-10.
11. Kimenai DM, Martens RJH, Kooman JP, et al. Troponin I and T in relation to cardiac injury detected with electrocardiography in a population-based cohort - The Maastricht Study. Sci Rep 2017;7:6610.
12. Ungerer JPJ, Tate JR, Pretorius CJ. Discordance with 3 cardiac troponin I and T assays: implications for the 99th percentile cutoff. Clin Chem 2016;62:1106-14.
13. Freda BJ, Tang WH, Van Lente F, Peacock WF, Francis GS. Cardiac troponins in renal insufficiency: review and clinical implications. J Am Coll Cardiol 2002;40:2065-71.
14. Artunc F, Mueller C, Breidthardt T, et al. Sensitive troponins--which suits better for hemodialysis patients? PLoS One 2012;7:e47610.
15. Twerenbold R, Wildi K, Jaeger C, et al. Optimal cutoff levels of more sensitive cardiac troponin assays for the early diagnosis of myocardial infarction in patients with renal dysfunction. Circulation 2015;131:2041-50.
16. Jaffe AS, Vasile VC, Milone M, Saenger AK, Olson KN, Apple FS. Diseased skeletal muscle: a noncardiac source of increased circulating concentrations of cardiac troponin T. J Am Coll Cardiol 2011;58:1819-24.
Cite This Article
Export citation file: BibTeX | RIS
OAE Style
McDonald S, Furmaga J, Vigen R, Muthukumar A, Hall HM, Turer A, Das SR, de Lemos JA, Diercks D. Assessment of agreement of two high sensitivity troponin assays during an institutional transition. Vessel Plus 2021;5:38. http://dx.doi.org/10.20517/2574-1209.2020.94
AMA Style
McDonald S, Furmaga J, Vigen R, Muthukumar A, Hall HM, Turer A, Das SR, de Lemos JA, Diercks D. Assessment of agreement of two high sensitivity troponin assays during an institutional transition. Vessel Plus. 2021; 5: 38. http://dx.doi.org/10.20517/2574-1209.2020.94
Chicago/Turabian Style
McDonald, Samuel, Jakub Furmaga, Rebecca Vigen, Alagarraju Muthukumar, Hurst M. Hall, Aslan Turer, Sandeep R. Das, James A. de Lemos, Deborah Diercks. 2021. "Assessment of agreement of two high sensitivity troponin assays during an institutional transition" Vessel Plus. 5: 38. http://dx.doi.org/10.20517/2574-1209.2020.94
ACS Style
McDonald, S.; Furmaga J.; Vigen R.; Muthukumar A.; Hall HM.; Turer A.; Das SR.; de Lemos JA.; Diercks D. Assessment of agreement of two high sensitivity troponin assays during an institutional transition. Vessel Plus. 2021, 5, 38. http://dx.doi.org/10.20517/2574-1209.2020.94
About This Article
Copyright

Data & Comments
Data
0

 Cite This Article 6 clicks

 Like This Article 21
likes
Like This Article 21
likes


Comments
Comments must be written in English. Spam, offensive content, impersonation, and private information will not be permitted. If any comment is reported and identified as inappropriate content by OAE staff, the comment will be removed without notice. If you have any queries or need any help, please contact us at support@oaepublish.com.