
Expanding the therapeutic window in acute ischemic stroke by advanced imaging

 ,
, Abstract
The treatment in acute ischemic stroke has shown extensive improvement in these recent years by new endovascular devices and advanced imaging. Advanced imaging is mainly led by perfusion imaging and has been powered by automated analyzing software. In this manuscript, we describe the history and the technology of perfusion imaging, including parameters and analyzing methods that have evolved from positron emission tomography and single-photon computed tomography to computed tomography perfusion and magnetic resonance imaging perfusion. The immense clinical advantage of advanced imaging is expansion of the therapeutic window by various mismatch assessments. Of these, perfusion-weighted imaging - core mismatch has managed to demonstrate the evidence in randomized control trials. A unique understanding of conventional imaging such as diffusion-weighted image - fluid-attenuated inversion recovery mismatch has also played a role in expanding the therapeutic window to wake-up strokes or unwitnessed strokes. In this article, these mismatch assessed trials are described with future insights.
Keywords
Introduction
In recent stroke diagnosis, imaging selection for achieving appropriate therapy is as essential as traditional neurological examination. Advanced imaging in stroke has dramatically influenced and explored the pathological conditions of the ischemic blood flow. Unfortunately, the COVID-19 pandemic has changed the world’s landscape and made a detailed neurological examination more difficult than ever. In particular, automated diagnostic imaging methods powered by artificial intelligence became more essential than ever before. After the publication of positive endovascular therapy (EVT) trials in 2015[1,2], or some people might say from 2012[3], perfusion imaging has become more popular and considered as a tool for therapeutic time expansion. Along with the unique use of conventional sequences such as diffusion-weighted image - fluid-attenuated inversion recovery (DWI-FLAIR) mismatch, the therapeutic window for acute ischemic stroke has expanded in these few years.
The history of perfusion imaging
The concept of perfusion imaging was first described in 1980[4], and over the next 40 years, perfusion imaging has become a tool used regularly for strokes for analyzing the blood flow conditions.
Perfusion imaging was routinely used as a marker of tumor lesions in the central nervous system by neurologists/neurosurgeons, enabling the differentiation of neoplasm from mass and the ability to distinguish the radiation necrosis from the tumor growth.
The estimation of cerebral blood flow was mainly done using positron emission tomography (PET) in the late 1960s[5]; and in the 1970s, the method turned out to be a gold standard for cerebral circulatory metabolic function in the human brain. In the 1980s, the basic concept of cerebral circulatory metabolism using PET and quantifying blood flow was established[6,7]. The previous depictions and studies for estimating cerebral blood flow were invasive using animal models, and it was essential to consider non-invasive methods for clinical application to humans. From that perspective, PET could estimate parameters such as cerebral blood flow (CBF), cerebral blood volume (CBV), oxygen extraction fraction (OEF), and cerebral metabolic rate of oxygen (CMRO2) non-invasively and repetitively compared to endovascular angiography. From these studies, a PET study in the subacute onset of stroke could estimate that brain tissue with CBF of less than 26 mL/100 g/min (in gray matter) and 12 mL/100 g/min (in white matter)[8] or CMRO2 of less than 65 mmol/100 g/min would turn into an ischemic tissue in several hours after the onset which can be confirmed by computed tomography (CT) scans. Before this phase, the ischemic brain tissue status, such as call penumbra, could be defined as which CBF is decreased, OEF is increased in compensation, and CMRO2 is maintained at an average quantity.
Analysis of penumbral imaging along with the ischemic core
PET has long been used as the main axis of non-invasive clinical examinations in the analysis of penumbral imaging, but only in the subacute phase of stroke. Therefore, the rapid investigation and use of penumbral imaging have been warranted in the emergency field. Along with the penumbral pattern in acute ischemic stroke, the ischemic core evaluation was showing progress.
In 1985 when the diffusion-weighted image (DWI) was first reported by Le Bihan et al.[9], this sequence was used clinically to visualize cytotoxic cerebral edema in brain tissues. Cytotoxic edema represents the corruption of ATP-dependent sodium/potassium membrane pumps. When cerebral ischemia occurs, autolysis begins, followed by proteolysis. The osmotic pressure in the brain cells expands due to increased intracellular water molecules, resulting in edema visualization. Moseley et al.[10] first reported the usage of ischemic brain tissues in humans in 1995, and this was thought to be one of the paradigm shifts in acute stroke imaging.
DWI is overwhelmingly superior to non-contrast CT in identifying ischemic cores around the penumbra, and with DWI it is possible to visualize acute infarct lesions more than the early CT signs[11-13] obtained by CT, with both higher sensitivity and specificity. It overwhelms imaging examinations and can detect acute infarct lesions more sensitively and accurately[14,15]. However, the infarct lesions indicated by DWI and early CT signs only detect the core region that has already turned into ischemia and cannot see and evaluate the penumbra region surrounding. If the reperfusion treatment is effective, comparing the abnormal perfusion region obtained by perfusion-weighted imaging (PWI) with the ischemic core would be highly essential for estimating how long the brain tissue can maintain the cerebral blood flow corruption. The concept of mismatch assessment is to calculate and evaluate the difference between the ischemic core and the abnormal perfusion region, and this would be the key to expanding the therapeutic window [Figure 1].
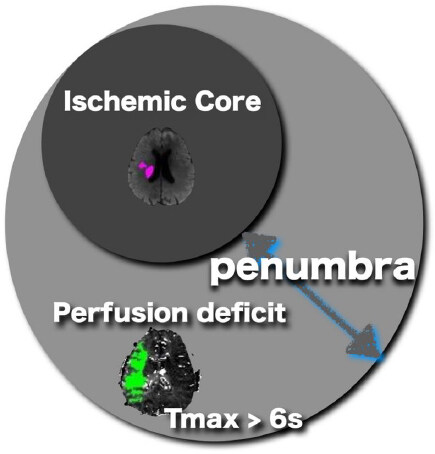
Figure 1. The schematic image representing the relation among ischemic core, perfusion deficit (Tmax > 6 s), and penumbra.
Modalities and analysis for perfusion imaging
The modality for perfusion imaging such as single-photon computed tomography (SPECT), PET, CT perfusion[16-18], or MRI perfusion[19-21] is used widely in clinical scenes. Of these, SPECT and PET are considered to be the gold standard for in vivo perfusion measurement because of their high sensitivity and reproducibility. However, SPECT and PET have radiation exposure and expensive examination costs, with long examination time. Especially for PET, the number of facilities is limited globally and it is challenging to use widely in clinical practice and emergency scenes. In comparison, CT perfusion and MRI perfusion, which dynamically inject and analyze the contrast agent while the scanning, can easily be applied to clinical practice in the emergency field. Additionally, there is also an advantage that these CT/MRI perfusion images can be added following the conventional CT or MRI scans, which are usually performed on stroke patients, and there is little time loss for the patient to move over several modalities.
There are several methods for MR perfusion analysis. Dynamic susceptibility contrast (DSC) method and dynamic contrast-enhanced (DCE) method are the two primary perfusion analysis methods using contrast media. DSC relies on the susceptibility-induced signal loss on T2* weighted images, which results from a bolus of gadolinium-based contrast passing through a capillary bed. On the other hand, DCE calculates perfusion parameters by evaluating T1 weighted image shortening induced by a gadolinium-based contrast bolus passing through tissue; it is more often used for tumors. For these reasons, DSC is usually performed in acute cerebral infarction. The CBV, CBF, mean transit time (MTT), time-to-peak, and time-to-maximum (Tmax) parameters are obtained from the first pass data. These parameters are also used in CT perfusion. The abnormal perfusion region is evaluated by analyzing the proportional or inverse proportional relationship in the region. There are various perfusion calculation methods for analyzing the parameters obtained from PWI in DSC, and the interpretation of the results is also controversial[22]. The DSC method is derived from the time contrast curve obtained from the contrast medium. The current mainstream method is to obtain the parameters from time contrast curve by deconvolution [Figure 2]. CBF, CBV, MTT, and Tmax are extracted from the arterial input function and venous output function near the middle cerebral artery or the anterior cerebral artery, and some factors depend on this arrangement and calculation. The important thing is that the deconvolution method is influenced by the delay effect of the contrast agent’s arrival. Standard singular value decomposition is known to be sensitive to the delay effect and dispersion, while block-circulant singular value decomposition (bcSVD) is known to be delay-insensitive. Although standard singular value decomposition reveals the apparent difference in contrast between the ischemic hemisphere and the normal hemisphere, it sometimes overestimated the ischemia.
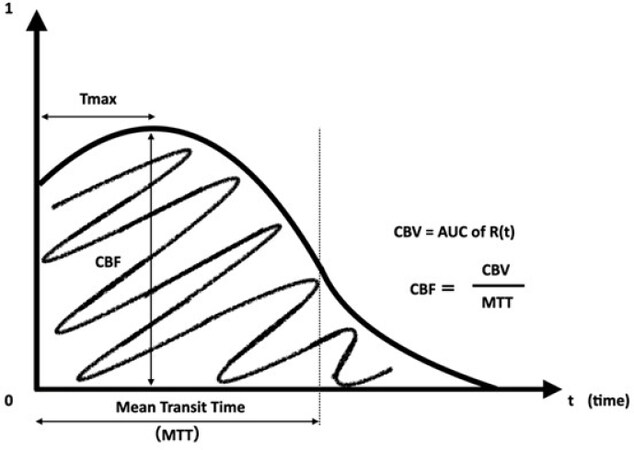
Figure 2. The residue function curve R(t) obtained from deconvolved time-concentration-curve. Mean transit time (MTT) and time-to-maximum (Tmax) parameters are directly measured from the curve. CBF (cerebral blood flow) and CBV (cerebral blood volume) are calculated from the time point of the curve.
On the other hand, bcSVD can provide tracer arrival timing-insensitive flow estimation and be a more specific ischemia indicator[22]. Therefore, it is essential to evaluate the perfusion image by understanding which analysis method is used to obtain the appropriate perfusion imaging and the characteristics of the analysis method. It should also be noted that the parameter value of each PWI changes depending on the arterial input function/venous output function setting because of its considerable effect on the motion artifact of the patient and the delay of the contrast agent, such as heart ejection failure, carotid artery stenosis, or technical issue in bolus injection.
Of these parameters, Tmax is the most important that represents the penumbral lesion. There are reports[23,24] showing that Tmax has the high specificity and sensitivity of the penumbra region obtained by PET and Xenon CT. A study comparing Tmax and PET verified that the time estimated region of Tmax > 5.5 s and PET showed a high correlation with high sensitivity and specificity[25]. Probabilistically, the most correlated parameter for penumbra in PWI is Tmax, and the threshold for the Tmax is organized as Tmax > 6 s. By comparing the core volume and PWI lesion volume with Tmax > 6 s in its ratio, the PWI - core mismatch [Figure 3] can expand the therapeutic window.
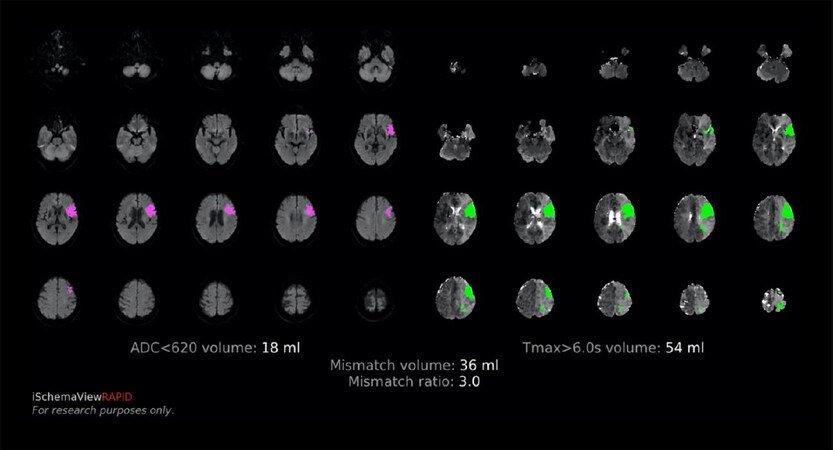
Figure 3. Example of the RAPID mismatch output map. The pink lesion in the left shows the estimated ischemic core (18 mL), and the green lesion shows the penumbra (54 mL), which has a mismatch ratio of 3.0. These profiled cases are called target mismatch and have a high response to reperfusion therapy beyond the time window.
PWI - core mismatch: CT or MRI
PWI - core mismatch uses differences in ratios between PWI and core surrounded by the penumbra[26-28]. In the past, the ratio was semi-quantified by eyeballing the ratio, but recently an automated software was produced. The first study which used an automated (retrospectively offline analyzed) PWI - core mismatch analysis software was the DEFUSE (diffusion and perfusion imaging evaluation for understanding stroke evolution) study[29]. Intravenous recombinant tissue plasminogen activator (rt-PA) was indicated within 3-6 h of onset in this study. They managed to describe the safety and effectiveness in prolonged time window patients with a PWI - core target mismatch. Rather than determining the indication for reperfusion therapy based on the “time” itself, the PWI - core mismatch can determine the brain status based on the “tissue time.” Cases with target mismatch are considered to have an excellent response to all reperfusion therapies, including endovascular treatment, regardless of onset time.
DEFUSE 2 was a prospective cohort study conducted from 2008 to 2011 and examined whether endovascular treatment would improve the outcome determined by the target mismatch selection group in 12 h onset[3]. The target mismatch group was determined by DWI-PWI mismatch, and it was defined as a PWI/DWI mismatch ratio of more than 1.8 and DWI volume smaller than 70 mL. Fully automatic software RAPID[30] was used for this image analysis. RAPID is a medical image software programmed in the C ++ language that calculates and analyzes MRI DWI / PWI and CT perfusion images. The digital imaging and communication in medicine (DICOM) images are automatically transferred from the scanner and analyzed in about 5 min, then sent back to the in-hospital picture archiving and communication systems (PACS). It is also possible to automatically email image maps to the stroke team or sent securely by mobile apps. As a result, in DEFUSE 2, the median ischemic core was 15.1 mL with an interquartile range (IQR) of 7.2-45.9, and the median time to puncture of endovascular treatment was 6.2 h (IQR: 4.9-8.1), and the reperfusion rate in the target mismatch group was 59%. However, when compared between the target mismatch group and the no target mismatch group, the adjusted odds ratio of achieving modified Rankin scale (mRS) 2 or less was 4.0 (95%CI: 1.3-12.2). This study successfully expanded the therapeutic window to 12 h by using the mismatch selection in endovascular therapy.
Expanding the therapeutic Window in EVT, up to 16-24 h maximum
In this sub-analysis of DEFUSE 2, some patients had a high variation of infarct grow speed, which can be explained by their collaterals and the existence of the penumbra within the time frame of 6-12 h[31]. The rate of expansion of ischemic core lesions in early-onset DWI was highly variable. Patients with a malignant profile[32,33] were found to have faster growth of ischemic core lesions than patients with target mismatch. Conversely, slow expansion of ischemic core lesions was associated with improved clinical outcome after reperfusion therapy with the recovery of the penumbra. In addition, the CT Perfusion to Predict Response to Recanalization in Ischemic Stroke Project (CRISP) study[34], in which a protocol similar to DEFUSE 2 verified only by CT perfusion, had a good prognosis in patients up to 18 h after onset with the target mismatch. The early window EVT trials such as EXTEND-IA[1] and SWIFT PRIME[2], which were mainly performed by CT perfusion, the evidence of acute CT perfusion for early and late-onset has been established.
As a culmination of the above, DEFUSE 3 study was designed to establish evidence from image selection by MRI perfusion and CT perfusion in late-onset ischemic strokes. DEFUSE 3 was designed to expand the therapeutic window up to 16 h who has a target mismatch, patients aged 18-90 years with National Institute of Health Stroke Scale (NIHSS) score of 6 or higher, premorbid mRS 0-2, and time window of 6-16 h for the EVT were included. As a radiological inclusion criterion, there should be a middle cerebral artery occlusion or internal carotid artery occlusion by magnetic resonance angiography or CT angiography. Ischemic core and penumbra would be analyzed and calculated by RAPID software. Cases with a target profile as PWI/DWI or CBF core mismatch ratio greater than 1.8, the ischemic core of 70 mL or less, and mismatch volume of 15 mL or more were enrolled. All devices that are approved by the United States Food and Drug Administration (FDA) were accepted. 182 cases were registered from 38 institutions. The frequency of mRS 0-2 after 90 days were 45% in the endovascular treatment group and 17% in the standard treatment group. The odds ratio was 2.77 (95%CI: 1.63-4.70; P <0.001), and the number needed to treat was 2. In terms of safety, the proportion of mRS 5-6 was 14% in the endovascular treatment group and 26% in the standard treatment group, which confirmed the safety with superiority (P = 0.05). After the publication of DEFUSE 3[35], the American Heart Association (AHA) stroke guidelines recommended the expanded the window up to 16 h by perfusion selection[36]. Together with the DAWN trial[37], which used clinical core mismatch as a surrogate of penumbra, the expanded therapeutic window by advanced imaging for EVT has been established.
Expanding the therapeutic Window in intravenous thrombolysis
The WAKE-UP study[38] randomized patients with acute cerebral infarction who had a DWI-FLAIR mismatch finding on MRI images into the alteplase treatment group (0.9 mg/kg) and the placebo treatment group. This was a study to investigate the efficacy and safety of intravenous alteplase thrombolytic therapy in wake-up or unknown onset stroke patients.
In the treatment of hyperacute ischemic stroke, the time from the onset is highly essential, and the golden time window for IVT is within 4.5 h. There is a high correlation between the degree of cerebral ischemia and the treatment time; the earlier the recanalization/reperfusion rate is, the better the clinical outcomes, and there is less secondary symptomatologic intracranial hemorrhage[39]. However, patients whose exact onset times are unknown do not fit into the hyperacute treatment time frame. About one-fourth of all cerebral infarction patients are reported to be in this wake-up/unknown onset population[40,41]. If some approach can determine the onset time, the number of patients who can receive reperfusion therapy should increase. Therefore, the method using the difference between the DWI and FLAIR images of MRI was considered[42]. Whereas DWI can visualize early ischemic changes within 1 h after the onset, FLAIR images are unlikely to show early ischemic changes within 3 to 4.5 h of onset. When a patient with a positive DWI and negative FLAIR images arrives, we can assume that the onset time is 3 to 4.5 h [Figure 4]. The WAKE-UP trial was designed with this DWI-FLAIR mismatch and was conducted at 61 facilities in eight European countries, mainly Germany. It was scheduled to enroll 800 patients from 2012 and ended early in June 2017.
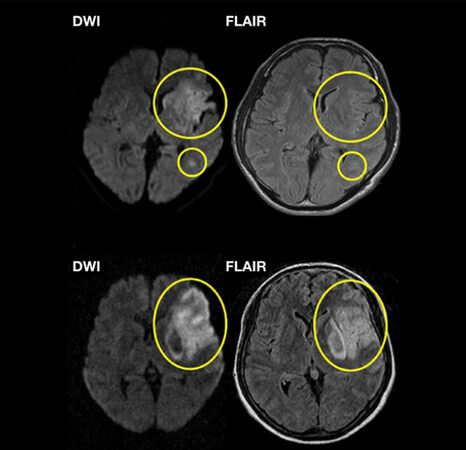
Figure 4. Sample of a DWI-FLAIR mismatch case. The upper figure shows DWI positive but FLAIR negative, which can suppose that this case is within 3 to 4.5 h of onset. The lower case has both positive signals in DWI and FLAIR which can be assume that onset is beyond 4.5 h.
The design was a randomized, double-blind, placebo-controlled trial with an intention-to-treat analysis. The primary endpoint was the rate of complete independence as mRS 0-1 at 90 days. As a result, a total of 503 patients were randomized, and 254 patients were assigned to the alteplase group, and 249 patients were assigned to the placebo group. The rate of mRS 0-1 at 90 days was 53.3% in the alteplase group, 41.8% in the placebo group, and the adjusted odds ratio was 1.61 (1.09-2.36; P = 0.02), indicating the effectiveness of alteplase in the wake-up strokes. The reasons for the unknown onset time were 89.4% in the alteplase group, and 89.2% in the placebo group, most of which were onset at wake-up, and the median NIHSS were both 6 (mild to moderate). Vascular occlusion was observed in 33.7% in the alteplase group and 34.1% in the placebo group. The ischemic core of DWI was 2.0 mL in the alteplase group and 2.5 mL in the placebo group, both of which were minor infarctions. The median mRS after 90 days was 1 for the alteplase group and 2 for the placebo group (adjusted odds ratio 1.62, 1.17-2.23, P = 0.003), and death after 90 days was 4.1% and 1.2%, respectively (adjusted odds ratio 3.38, 0.92-12.52, P =0.07). As a safety endpoint, intraparenchymal hematomas type 2 (PH2) was higher (4.0%) in the alteplase group than in the placebo group (0.4%) (adjusted odds ratio 10.46, 1.32-82.77, P = 0.03), and symptomatic intracranial hemorrhage (sICH) was 2.0% and 0.4% respectively (adjusted odds ratio 4.95, 95%CI: 0.57-42.87, P = 0.15) based on the SITS-MOST criteria[43], but with no significant difference. In summary, IVT was safe and effective in waking up patients who had a DWI-FLAIR mismatch on MRI imaging even with or without occluded blood vessels.
In Japan, a similar wake-up trial, the THAWS study, completed registration in July 2018 following the WAKE-UP study results and was also published[44]. The THAWS study is slightly different from the WAKE-UP study, such as the PROBE method (Prospective, Randomized, Open, Blinded-Endpoint) that does not use a placebo drug, and the use of a Japanese-specific alteplase dose (alteplase 0.6 mL/kg)[45]. Forty facilities participated, and 131 patients were registered. Although the rate of mRS 0-1 at 90 days was not significantly different between the alteplase group and the standard medical treatment group (47% vs. 48%, relative risk 0.97, 95%CI: 0.68-1.41, P = 0.892), in terms of safety, both sICH (PH type 2 bleeding and deterioration in NIHSS 4 points or higher, 1.4% vs. 0%, P > 0.99) and death (2.8% vs. 3.3%, P > 0.99) at 90 days onset had no significant difference between the groups. Several reasons can explain why the efficacy could not be shown, as in the WAKE-UP study. One was that the number of registrants was about 50% of the initial plan due to the early termination of the study, and the registration term was strongly overlapped when the EVT showed substantial evidence. Thus, many wake-up patients were taken to the cath lab instead. Another is that the study plan was open-labeled, and aggressive antithrombotic therapy such as antiplatelet dual-drug therapy could be started early in the medical treatment group, which double-blinded group (such as WAKE-UP trial) had to wait for 24 h after the infusion of alteplase/placebo. To supplement this result, we have performed a sub-study and reported that patients with specific core volume (> 6.4 mL) would benefit from wake-up IVT even with the low dose alteplase[46].
Recently, the meta-analysis for wake-up trials was published[47], including WAKE-UP (DWI-FLAIR mismatch), THAWS (DWI-FLAIR mismatch), ECASS4 (PWI-core mismatch), and EXTEND (PWI-core mismatch)[48]. The two different radiological approaches to expand the time window are interesting, while the PWI-core mismatch selection group also published a meta-analysis including EXTEND, ECASS4-EXTEND, and EPITHET[49]. From their conclusion, patients within 4.5 to 9 h from stroke onset or wake-up stroke with salvageable brain tissue had better functional outcomes treated with alteplase than placebo, which “literally” expanded the IVT time window. Although DWI-FLAIR mismatch may not be called an advanced imaging compared to the PWI-core mismatch, the use of conventional sequences was unique and could be considered in many facilities to identify patients with an acute ischemic stroke of unknown time of onset evolving for less than 4.5 h.
Conclusion and future directions
The therapeutic window has shown expansion in these years by evaluating various mismatches using advanced imaging in acute ischemic strokes. Radiological information has demonstrated efficacy to visualize things that neurological examination cannot be seen, such as penumbra. As the trials written above have expanded the therapeutic window by advanced imaging, we may have more advanced imaging to achieve a wider therapeutic window and better clinical outcomes in the near future.
Declarations
Authors’ contributionWrote the first draft and designed the study and interpretation: Inoue M
Supervised and critically reviewed the report, and approved the final version: Toyoda K
Availability of data and materialsNot applicable.
Financial support and sponsorshipNone.
Conflicts of interestAll authors declared that there are no conflicts of interest.
Ethical approval and consent to participateNot applicable.
Consent for publicationNot applicable.
Copyright© The Author(s) 2021.
REFERENCES
1. Campbell BC, Mitchell PJ, Kleinig TJ, et al; EXTEND-IA Investigators. Endovascular therapy for ischemic stroke with perfusion-imaging selection. N Engl J Med 2015;372:1009-18.
2. Saver JL, Goyal M, Bonafe A, et al; SWIFT PRIME Investigators. Stent-retriever thrombectomy after intravenous t-PA vs. t-PA alone in stroke. N Engl J Med 2015;372:2285-95.
3. Lansberg MG, Straka M, Kemp S, et al. MRI profile and response to endovascular reperfusion after stroke (DEFUSE 2): a prospective cohort study. Lancet Neurol 2012;11:860-7.
4. Axel L. Cerebral blood flow determination by rapid-sequence computed tomography: theoretical analysis. Radiology 1980;137:679-86.
5. Ter-Pogossian MM, Eichling JO, Davis DO, Welch MJ, Metzger JM. The determination of regional cerebral blood flow by means of water labeled with radioactive oxygen 15. Radiology 1969;93:31-40.
6. Frackowiak RS, Lenzi GL, Jones T, Heather JD. Quantitative measurement of regional cerebral blood flow and oxygen metabolism in man using 15O and positron emission tomography: theory, procedure, and normal values. J Comput Assist Tomogr 1980;4:727-36.s.
7. Astrup J, Siesjö BK, Symon L. Thresholds in cerebral ischemia - the ischemic penumbra. Stroke 1981;12:723-5.
8. Bammer R, et al. MR and CT Perfusion and Pharmacokinetic Imaging: Clinical Applications and Theoretical Principles. 1st Edition. Wolters Kluwer, Philadelphia, USA; 2016.
9. Le Bihan D, Breton E. Imagerie de diffusion in vivo par résonance magnétique nucléaire. C R Acad Sci Paris 1985;T.301:1109-12.
10. Moseley ME, Butts K, Yenari MA, Marks M, de Crespigny A. Clinical aspects of DWI. NMR Biomed 1995;8:387-96.s.
11. Launes J, Ketonen L. Dense middle cerebral artery sign: an indicator of poor outcome in middle cerebral artery area infarction. J Neurol Neurosurg Psychiatry 1987;50:1550-2.
12. Pressman BD, Tourje EJ, Thompson JR. An early CT sign of ischemic infarction: increased density in a cerebral artery. AJR Am J Roentgenol 1987;149:583-6.
13. Truwit CL, Barkovich AJ, Gean-Marton A, Hibri N, Norman D. Loss of the insular ribbon: another early CT sign of acute middle cerebral artery infarction. Radiology 1990;176:801-6.
14. Lutsep HL, Albers GW, DeCrespigny A, Kamat GN, Marks MP, Moseley ME. Clinical utility of diffusion-weighted magnetic resonance imaging in the assessment of ischemic stroke. Ann Neurol 1997;41:574-80.
15. Baird AE, Warach S. Magnetic resonance imaging of acute stroke. J Cereb Blood Flow Metab 1998;18:583-609.
16. Koenig M, Klotz E, Luka B, Venderink DJ, Spittler JF, Heuser L. Perfusion CT of the brain: diagnostic approach for early detection of ischemic stroke. Radiology 1998;209:85-93.
17. Roberts HC, Roberts TP, Smith WS, Lee TJ, Fischbein NJ, Dillon WP. Multisection dynamic CT perfusion for acute cerebral ischemia: the “toggling-table” technique. AJNR Am J Neuroradiol 2001;22:1077-80.
18. König M. Brain perfusion CT in acute stroke: current status. Eur J Radiol 2003;45 Suppl 1:S11-22.
19. Hossmann KA, Hoehn-Berlage M. Diffusion and perfusion MR imaging of cerebral ischemia. Cerebrovasc Brain Metab Rev 1995;7:187-217.
20. Ostergaard L, Weisskoff RM, Chesler DA, Gyldensted C, Rosen BR. High resolution measurement of cerebral blood flow using intravascular tracer bolus passages. Part I: Mathematical approach and statistical analysis. Magn Reson Med 1996;36:715-25.
21. Ostergaard L, Sorensen AG, Kwong KK, Weisskoff RM, Gyldensted C, Rosen BR. High resolution measurement of cerebral blood flow using intravascular tracer bolus passages. Part II: Experimental comparison and preliminary results. Magn Reson Med 1996;36:726-36.
22. Wu O, Østergaard L, Weisskoff RM, Benner T, Rosen BR, Sorensen AG. Tracer arrival timing-insensitive technique for estimating flow in MR perfusion-weighted imaging using singular value decomposition with a block-circulant deconvolution matrix. Magn Reson Med 2003;50:164-74.
23. Olivot JM, Mlynash M, Zaharchuk G, et al. Perfusion MRI (Tmax and MTT) correlation with xenon CT cerebral blood flow in stroke patients. Neurology 2009;72:1140-5.
24. Zaro-Weber O, Moeller-Hartmann W, Heiss WD, Sobesky J. MRI perfusion maps in acute stroke validated with 15O-water positron emission tomography. Stroke 2010;41:443-9.
25. Zaro-Weber O, Moeller-Hartmann W, Heiss WD, Sobesky J. Maps of time to maximum and time to peak for mismatch definition in clinical stroke studies validated with positron emission tomography. Stroke 2010;41:2817-21.
26. Rordorf G, Koroshetz WJ, Copen WA, et al. Regional ischemia and ischemic injury in patients with acute middle cerebral artery stroke as defined by early diffusion-weighted and perfusion-weighted MRI. Stroke 1998;29:939-43.
27. Barber PA, Darby DG, Desmond PM, et al. Prediction of stroke outcome with echoplanar perfusion- and diffusion-weighted MRI. Neurology 1998;51:418-26.
28. Neumann-Haefelin T, Wittsack HJ, Wenserski F, et al. Diffusion- and perfusion-weighted MRI. The DWI/PWI mismatch region in acute stroke. Stroke 1999;30:1591-7.
29. Albers GW, Thijs VN, Wechsler L, et al; DEFUSE Investigators. Magnetic resonance imaging profiles predict clinical response to early reperfusion: the diffusion and perfusion imaging evaluation for understanding stroke evolution (DEFUSE) study. Ann Neurol 2006;60:508-17.
30. Straka M, Albers GW, Bammer R. Real-time diffusion-perfusion mismatch analysis in acute stroke. J Magn Reson Imaging 2010;32:1024-37.
31. Wheeler HM, Mlynash M, Inoue M, et al; DEFUSE 2 Investigators. The growth rate of early DWI lesions is highly variable and associated with penumbral salvage and clinical outcomes following endovascular reperfusion. Int J Stroke 2015;10:723-9.
32. Mlynash M, Lansberg MG, De Silva DA, et al; DEFUSE-EPITHET Investigators. Refining the definition of the malignant profile: insights from the DEFUSE-EPITHET pooled data set. Stroke 2011;42:1270-5.
33. Inoue M, Mlynash M, Straka M, et al. Patients with the malignant profile within 3 hours of symptom onset have very poor outcomes after intravenous tissue-type plasminogen activator therapy. Stroke 2012;43:2494-6.
34. Lansberg MG, Christensen S, Kemp S, et al; CT Perfusion to Predict Response to Recanalization in Ischemic Stroke Project (CRISP) Investigators. Computed tomographic perfusion to predict response to recanalization in ischemic stroke. Ann Neurol 2017;81:849-56.
35. Albers GW, Marks MP, Kemp S, et al; DEFUSE 3 Investigators. Thrombectomy for stroke at 6 to 16 hours with selection by perfusion imaging. N Engl J Med 2018;378:708-18.
36. Powers WJ, Rabinstein AA, Ackerson T, et al; American Heart Association Stroke Council. 2018 guidelines for the early management of patients with acute ischemic stroke: a guideline for healthcare professionals from the American Heart Association/American Stroke Association. Stroke 2018;49:e46-e110.
37. Nogueira RG, Jadhav AP, Haussen DC, et al; DAWN Trial Investigators. Thrombectomy 6 to 24 hours after stroke with a mismatch between deficit and infarct. N Engl J Med 2018;378:11-21.
38. Thomalla G, Simonsen CZ, Boutitie F, et al; WAKE-UP Investigators. MRI-guided thrombolysis for stroke with unknown time of onset. N Engl J Med 2018;379:611-22.
39. Emberson J, Lees KR, Lyden P, et al. Effect of treatment delay, age, and stroke severity on the effects of intravenous thrombolysis with alteplase for acute ischaemic stroke: a meta-analysis of individual patient data from randomised trials. Lancet 2014;384:1929-35.
40. Kang DW, Sohn SI, Hong KS, et al. Reperfusion therapy in unclear-onset stroke based on MRI evaluation (RESTORE): a prospective multicenter study. Stroke 2012;43:3278-83.
41. Koton S, Tanne D, Bornstein NM; NASIS Investigators. Ischemic stroke on awakening: patients’ characteristics, outcomes and potential for reperfusion therapy. Neuroepidemiology 2012;39:149-53.
42. Thomalla G, Rossbach P, Rosenkranz M, et al. Negative fluid-attenuated inversion recovery imaging identifies acute ischemic stroke at 3 hours or less. Ann Neurol 2009;65:724-32.
43. Toni D, Lorenzano S, Puca E, Prencipe M. The SITS-MOST registry. Neurol Sci 2006;27 Suppl 3:S260-2.
44. Koga M, Yamamoto H, Inoue M, et al; THAWS Trial Investigators. Thrombolysis with Alteplase at 0.6 mg/kg for stroke with unknown time of onset: a randomized controlled trial. Stroke 2020;51:1530-8.
45. Toyoda K, Koga M, Iguchi Y, et al. Guidelines for intravenous thrombolysis (recombinant tissue-type plasminogen activator), the third edition, March 2019: a guideline from the Japan Stroke Society. Neurol Med Chir (Tokyo) 2019;59:449-91.
46. Toyoda K, Inoue M, Yoshimura S, et al; THAWS trial investigators*. Magnetic resonance imaging-guided thrombolysis (0.6 mg/kg) was beneficial for unknown onset stroke above a certain core size: THAWS RCT substudy. Stroke 2021;52:12-9.
47. Thomalla G, Boutitie F, Ma H, et al. Intravenous alteplase for stroke with unknown time of onset guided by advanced imaging: systematic review and meta-analysis of individual patient data. Lancet 2020;396:1574-84.
48. Ma H, Campbell BCV, Parsons MW, et al; EXTEND Investigators. Thrombolysis guided by perfusion imaging up to 9 hours after onset of stroke. N Engl J Med 2019;380:1795-803.
Cite This Article
Export citation file: BibTeX | RIS
OAE Style
Inoue M, Toyoda K. Expanding the therapeutic window in acute ischemic stroke by advanced imaging. Vessel Plus 2021;5:11. http://dx.doi.org/10.20517/2574-1209.2020.99
AMA Style
Inoue M, Toyoda K. Expanding the therapeutic window in acute ischemic stroke by advanced imaging. Vessel Plus. 2021; 5: 11. http://dx.doi.org/10.20517/2574-1209.2020.99
Chicago/Turabian Style
Inoue, Manabu, Kazunori Toyoda. 2021. "Expanding the therapeutic window in acute ischemic stroke by advanced imaging" Vessel Plus. 5: 11. http://dx.doi.org/10.20517/2574-1209.2020.99
ACS Style
Inoue, M.; Toyoda K. Expanding the therapeutic window in acute ischemic stroke by advanced imaging. Vessel Plus. 2021, 5, 11. http://dx.doi.org/10.20517/2574-1209.2020.99
About This Article
Special Issue
Copyright

Data & Comments
Data


 Cite This Article 3 clicks

 Like This Article 20
likes
Like This Article 20
likes


Comments
Comments must be written in English. Spam, offensive content, impersonation, and private information will not be permitted. If any comment is reported and identified as inappropriate content by OAE staff, the comment will be removed without notice. If you have any queries or need any help, please contact us at support@oaepublish.com.