
Troponin status predicts 30-day in-hospital mortality
 0
0Abstract
Aim: To evaluate the prognostic value of high-sensitivity cardiac troponin (hscTnT) levels in unselected emergency medical admissions.
Methods: We report on all hscTnT tests in emergency medical admissions, performed over an eight year period from 2011-2018. The prognostic significance of hscTnT was related to 30-day in-hospital mortality with multivariable logistic regression, adjusted for Acute Illness Severity Score, Comorbidity Score, Sepsis, and Deprivation Status.
Results: There were 52,214 admissions from 28,982 patients during the study period. HscTnT level was a univariate - odds ratios (OR) 1.67 [95% confidence intervals (CI): 1.60-1.73] and an independent risk predictor in the multivariable logistic regression model - OR = 1.23 (95%CI: 1.16-1.29). 30-day in-hospital mortality increased as a linear function of hscTnT; not performed = 3.6%, ≥ 25 ng/L = 5.3%, > 100 ng/L = 7.4%, > 1000 ng/L = 8.8%. Increasing Comorbidity Score exacerbated risk; 30-day in-hospital mortality at a Score of 6, 10 and 16 points for those with no hscTnT performed or hscTnT < 25 ng/L were 1.8%, 6.5% and 31.3% respectively; for hscTnT ≥ 25 ng/L these increased to 2.2%, 8.8% and 41.3%.
Conclusion: HscTnT is prognostic in acutely ill medical patients; incorporation into hospital mortality predictive algorithms appears warranted.
Keywords
Introduction
Acute medicine encompasses the rapid specialist management of patients suffering from a wide variety of medical conditions requiring expedited care[1]. The admitted cohort are a relatively high risk group, although 30-day in-hospital mortality rates in our institution have improved over time from 6.7% in 2002, to 4.7% in 2012, and 3.7% in 2018; the 7% absolute mortality reduction is comparable with the USA National Hospital Discharge Survey data showing a decrease of 8% in inpatient hospital deaths over the years 2000 to 2010[2]. Nonetheless there has to be a constant emphasis, if outcomes are to be maintained and even improved, on risk factor assessment at admission and identifying prognostic factors amenable to intervention - the two most important of these are illness severity and comorbidities[3]. As our hospital covers an inner city catchment area with a predominantly aging population and over 50% of patients have a high deprivation index[4] - we also have a focus on the impact of low socioeconomic status (SES).
Among biomarkers that have become available over the past decade, serum troponin T as a cardio-specific biomarker has achieved widespread use in clinical medicine; with cardiac injury these macromolecules diffuse into the cardiac interstitium with subsequent detection in the peripheral circulation. Cardiac-specific troponins have utility because they combine value as a near ideal biologic marker, and also convey useful prognostic information that can influence therapeutic decision making[5]. Troponin assays were initially developed for their utility in acute coronary syndromes[6], however, it was quickly recognized that a range of other medical conditions were also associated with troponin elevation[7-20]. Although troponin elevation signifies cardiac damage, it may not always imply cardio-specificity with predictive values as low as 56% in the diagnosis of acute coronary syndromes[21]. Troponin assays are a relatively common laboratory diagnostic request in emergency medical admissions.
There has been little published on the utility of troponin in unselected emergency medical admissions. We have a large database covering all emergency medical patients admitted to our institution (St James’ Hospital, Dublin), between 2002 and 2018 inclusive - but high sensitivity troponin data was limited to 2011-18. The purpose of this study was to examine the predictive role of high sensitivity cardiac troponin (hscTnT) levels on 30-day in-hospital mortality in acutely ill medical patients admitted via the Emergency Department (ED).
Methods
Background
Our institution, St James’s Hospital provides an emergency admission function covering a population of 270,000 adults. This paper covers all patients admitted under the general/internal medicine service from 2011-2018; patients with acute coronary syndromes (ACS) are by design admitted under cardiology and were not included in this analysis. Medical admissions are by design admitted from the ED to an Acute Medical Admission Unit (AMAU). We have described the details of the operation and performance of the AMAU previously[22-26]. As a city centre hospital, St James’s admits visitors to Dublin city and persons people residing outside of the hospital catchment area, but working in the city, in addition to visitors to the city. 74.5% of emergency admissions are resident in our catchment area.
Data collection
We have established an anonymous patient database within our institution. This database collates information for each hospital admission including details from the patient administration system, national hospital in-patient enquiry (HIPE) scheme, the electronic patient record and laboratory result systems. HIPE is a national database of coded hospital discharge summaries from all public hospitals within Ireland[27,28]. The International Classification of Diseases, Ninth Revision, Clinical Modification (ICD-9-CM) was used for both diagnosis and procedure coding from 1990 to 2005 with a subsequent transition to ICD-10-CM. Data recorded in the database include the date of admission and discharge, the unique patient identifier, sex, date of birth, treating physician, address, diagnosis (principal and up to nine secondary), and procedures performed (principal and up to nine secondary). Physiological and laboratory results are automatically cross-linked and added to the database using the hospitals other systems.
Troponin measurements
In January 2011, our institution introduced a hscTnT assay (Roche Diagnostics) to replace the previous 4th-generation cardiac troponin assay. Analysis was performed using a Roche cobas® 8000 analyser. No changes to the analyser or assay were made during the study period. The performance characteristics of the hscTnT assay were such that upper limit of normal was represented by the 99th centile of 14 ng/L. However, as non-ischaemic myocardial strain could result in an elevated hscTnT, a value of ≥ 53 ng/L was deemed to be a strong predictor of significant myocardial injury. In the current study, we have defined troponin-negative as hscTnT < 25 ng/L and troponin-positive as hscTnT ≥ 25 ng/L. We further divided patients into six groups based on hscTnT results: (1) no troponin assay requested; (2) < 25 ng/L; (3) 25-49 ng/L; (4) 50-99 ng/L; (5) 100-1000 ng/L; and (6) > 1000 ng/L. These cut-offs were chosen on the previously defined rounded hscTnT value of 50 ng/L being predictive of true myocardial injury.
Risk predictors
We have previously derived and applied an Acute Illness Severity Score (AISS)[29], predicting 30-day in-hospital mortality from laboratory parameters recorded in the ED[30]. This weighted age adjusted score defines six risk groups (I-VI) with cut-points for 30-day in-hospital mortality set at 1, 2, 4, 8 and 16%. We further adjusted for Comorbidity as described below. In addition Sepsis categories of (1) no blood culture request (2) negative blood culture and (3) positive blood culture were identified and used as an adjustor in the multivariable logistic regression model[31].
Comorbidity score
In this study, comorbidity was assessed by a Comorbidity Score which we have derived[32]. The first incarnation of this score was published in 2014 and an updated version has subsequently been published[3]. The Comorbidity Score was derived from searching the hospital system for ICD codes that captured functionally limiting chronic physical or mental health disorders. These ICD codes were then grouped into the following ten systems: (1) cardiovascular; (2) respiratory; (3) neurological; (4) gastrointestinal; (5) diabetes; (6) renal; (7) neoplastic disease; (8) others (including rheumatological disabilities); (9) ventilatory assistance required; and (10) transfusion requirement. We additionally searched other existing databases in our instituion for evidence of diabetes (Diamond database)[33], impaired respiratory function (FEV1 < 2 L), hscTnT ≥ 25 ng/L[34], albumin < 35 G/dL, haemoglobin < 10 G/dL, and chronic kidney disease - MDRD < 60 mL/min × 1.73 m2[35]. The components of the score were then appropriately weighted according to 30-day in-hospital mortality.
Deprivation index
The smallest unit for which the Republic of Ireland Census reports results is the Electoral Division. There are approximately 3,440 of these small administrative areas; data from sparsely populated Electoral Divisions are merged where required to maintain confidentiality. This process resulted in a final total of 3,409 Electoral Divisions having available statistics. The SAHRU investigators employed principle components analysis to generate a Deprivation Index using a weighted combination of four indicators; unemployment, social class, type of housing tenure and car ownership[36]. Deprivation Index scores were then divided into quintiles according to their ranked raw scores from Q1 (least deprived) to Q5 (most deprived). This data was then joined to the small area polygon geometries based upon their relative geographic positions, using the ArcGS Geographic Information System software implementation of the Point-in-Polygon algorithm[37].
Statistical methods
We generated descriptive statistics for background demographic data, using mean and standard deviation, median and inter-quartile range (IQR), or percentage where appropriate. We used chi-square tests for comparisons between categorical variables and 30-day in-hospital mortality. Over our prolonged 8 year study period, many patients were admitted more than once; 62%, 42% and 30.4% were admitted more than once, twice, or three times respectively, with 7.9% admitted > 10 times. There will be a difference in mortality rate if calculated by admission or by patient (only last admission considered if > 1); in this study calculated mortality is therefore explicitly stated as per admission or as per patient. In order to allow for clustering we utilized a logistic regression model with robust estimate[29]. This logistic regression analysis was used to identify potential predictors of mortality in our dataset. Identified significant univariate predictors, as defined by P < 0.1 by Wald test, were then examined in the multivariate model to achieve optimized prediction. We adjusted 30-day in-hospital mortality for other known predictor variables including AISS[29,38], Comorbidity Score[39,40] and Sepsis status[31]. We used computations of average marginal effects to estimate and interpret adjusted predictions for sub-groups while controlling for other variables. The model parameters were stored; post-estimation intra-model and cross-model hypotheses could thereby be tested. We calculated adjusted OR and 95%CI for significant predictors. Statistical significance at P < 0.05 was assumed throughout. Stata v.15 (Stata Corporation, College Station, Texas) statistical software was used for analysis.
Results
Patient demographics
There were a total of 52,214 emergency medical admissions in 28,982 patients over the 8 year study period (2011-2018). 48.6% of admissions were male. The median (IQR) length of stay (LOS) was 5.0 (2.1, 9.5) days. The median (IQR) age was 64.7 (45.2, 78.9) years, with the upper 10% boundary at 86.2 years. Between 2011 and 2018, there was a linear decline in 30-day in-hospital mortality. Calculated per admission episode, the 30-day in-hospital mortality averaged 3.9% (95%CI: 3.8%-4.1%) with no statistical change over time (P = 0.07). Calculated on a per patient basis (last admission if > 1), the 30-day in-hospital mortality averaged 7.1% (95%CI: 6.8%-7.4%) with a relative risk reduction of 39.7% from 8.1 % to 4.9% (P = 0.001) and calculated NNT of 31.1.
The baseline characteristic of admissions stratified by hscTnT level are outlined in Table 1. Admissions with a positive hscTnT result were older at median (IQR) 75 years (60.2, 83.6) vs. 61 years (42.4, 76.4). Gender balance appeared similar at 49.8% vs. 50.2%. Admissions with a positive hscTnT had a longer median (IQR) LOS at 6.6 days (3.1, 12.3) vs. 4.6 days (2.0, 8.7). Admissions with a positive hscTnT were much more likely to have high AISS (Group 5/6 81.6% vs. 54.5%), Sepsis status (Culture positive 3.7% vs. 2.8%) and Comorbidity Score (> 10 points - 65% vs. 41.3%). They had more Major Disease Categories of respiratory (MDC 4) and cardiac (MDC 5), but less neurology (MDC 1) in primary diagnoses.
Demographics of emergency admissions (2011-2018) by hscTnT status
| Factor | Level | hscTnT - | hscTnT + | P-value |
|---|---|---|---|---|
| N | 40,484 | 11,730 | ||
| Gender | Male | 19,652 (48.5%) | 5,836 (49.8%) | 0.02 |
| Female | 20,832 (51.5%) | 5,894 (50.2%) | ||
| Age, median (IQR) | 61.0 (42.2, 76.4) | 75.0 (60.2, 83.6) | < 0.001 | |
| Length of stay (days) | 4.6 (2.0, 8.7) | 6.6 (3.1, 12.3) | < 0.001 | |
| Outcome | Alive | 39,368 (97.2%) | 10,788 (92.0%) | < 0.001 |
| Died | 1,116 (2.8%) | 942 (8.0%) | ||
| AISS | 1 | 1,426 (4.2%) | 160 (1.5%) | < 0.001 |
| 2 | 2,868 (8.4%) | 321 (3.0%) | ||
| 3 | 4,852 (14.3%) | 559 (5.2%) | ||
| 4 | 6,302 (18.6%) | 935 (8.7%) | ||
| 5 | 7,035 (20.7%) | 1,518 (14.2%) | ||
| 6 | 11,470 (33.8%) | 7,225 (67.4%) | ||
| Sepsis status | 1 | 32,332 (79.9%) | 8,591 (73.2%) | < 0.001 |
| 2 | 7,011 (17.3%) | 2,701 (23.0%) | ||
| 3 | 1,141 (2.8%) | 438 (3.7%) | ||
| Co-morbidity score | < 6 | 23,765 (58.7%) | 4,090 (34.9%) | < 0.001 |
| < 10 | 13,037 (32.2%) | 5,121 (43.7%) | ||
| < 13 | 2,793 (6.9%) | 1,781 (15.2%) | ||
| < 16 | 648 (1.6%) | 485 (4.1%) | ||
| < 20 | 231 (0.6%) | 231 (2.0%) | ||
| MDC | Neuro | 7,724 (18.0%) | 876 (11.9%) | < 0.001 |
| Resp. | 10,417 (24.3%) | 2,327 (31.7%) | ||
| Cardiac | 6,378 (14.9%) | 1,796 (24.5%) |
HscTnT level and 30-day in-hospital mortality
HscTnT was a univariate linear predictor of 30-day in-hospital mortality [OR 1.67 (95%CI: 1.60-1.73)]. In the multivariable model adjusted for other significant risk predictors of AISS [OR 2.59 (95%CI: 2.25-2.98)], Comorbidity Score [OR 1.28 (95%CI: 1.25-1.30)] and Sepsis Status [OR 1.19 (95%CI: 1.06-1.33)], the OR was 1.23 (95%CI: 1.16-1.29). Irrespective of whether 30-day in-hospital mortality was calculated either by patient or by all admissions, mortality increased as a linear function of hscTnT result [Figure 1]. Per admission 30-day in-hospital mortality with no troponin performed was 3.6 % (95%CI: 3.4-3.9), but for hscTnT ≥ 25 ng/L this rose to 5.3 % (95%CI: 4.9-5.6); and there were further mortality elevations at troponin levels ≥ 100 ng/L and 1000 ng/L to 7.4 % (95%CI: 6.6-8.3) and 8.8 % (95%CI: 7.5-10.0) respectively.
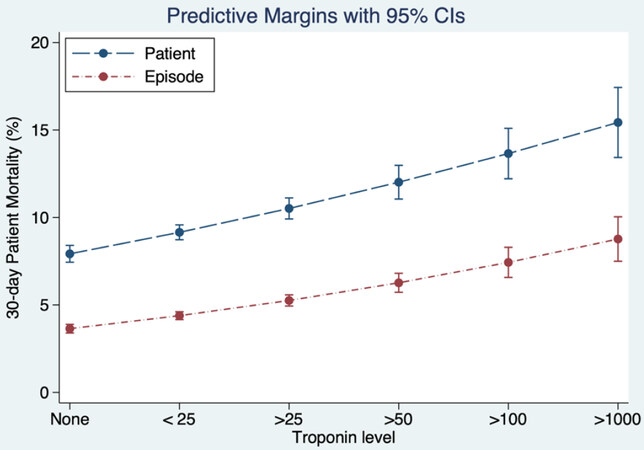
Figure 1. hscTnT level (ng/L) linearly predicted outcome. The multivariable logistic regression model was adjusted for Acute Illness Severity Score, Comorbidity Score, and Sepsis status. Increasing hscTnT level predicted 30-day in-hospital mortality (calculated on per admission episode or on unique patient basis) derived from and plotted based on the model prediction. hscTnT: high-sensitivity cardiac troponin
Conditional Dependence of hscTnT on Comorbidity Score
It is important to appreciate the relationship between hscTnT level, the underlying Comorbidity Score, and 30-day in-hospital mortality. Increasing Comorbidity Score was associated with a marked deterioration in 30-day in-hospital mortality [Figure 2]. We considered a Comorbidity Score of 10 points the inflexion point between lower and higher risk with only 11.3% of admitted patients being in this category. The model predicted 30-day in-hospital mortality per admission at a Comorbidity Score of 6, 10 and 16 points for those with no hscTnT performed, or a hscTnT < 25 ng/L were 1.8%, 6.5% and 31.3%, but in the presence of hscTnT ≥ 25 ng/L, this increased to 2.2%, 8.8% and 41.3% respectively.
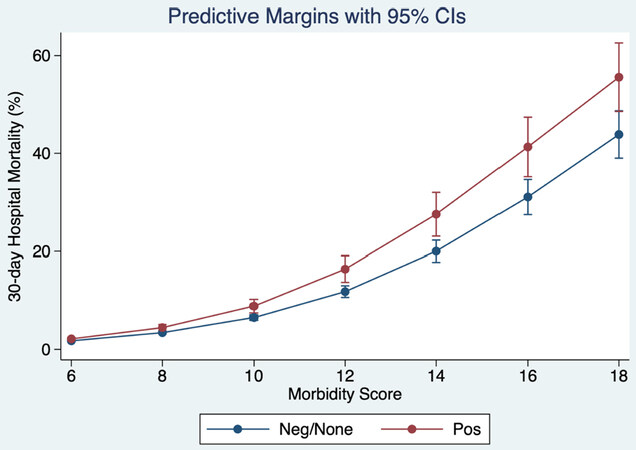
Figure 2. 30-day in-hospital mortality (per admission) related to Comorbidity Score and by hscTnT category from the multivariable logistic regression model. The predicted probabilities were derived from and plotted based on the model prediction. Data adjusted for Acute Illness Severity Score, Sepsis status and hscTnT category [negative (< 25 ng/L) or not performed vs. positive (≥ 25ng/L)]. hscTnT: high-sensitivity cardiac troponin
30-day in-hospital mortality for no hscTnT performed vs. hscTnT < 25 ng/L
The result of a test clearly conveys information, however, information may also be implied in the performance of a test, even if the result is negative. In our study, 30-day in-hospital mortality for patients with no hscTnT performed and hscTnT < 25 ng/L were quite different, but this observation applied mainly to high risk individuals. Overall, the mortality outcomes for the groups of no test, hscTnT < 25 ng/L, and hscTnT ≥ 25 ng/L were 2.7%, 3.9%, and 10.3% (P < 0.001: one-way ANOVA with Scheffe’s multiple comparison). At the lower end of Comorbidity Score, the difference appeared very small, but at Comorbidity scores of 10, 14 and 16 points, the difference in 30-day in-hospital mortality for no test vs. hscTnT < 25 ng/L were (10 points) 3.3% vs. 5.0% (14 points) 8.0% vs. 13.3% and (16 points) 12.1% vs. 20.0% [Figure 3].
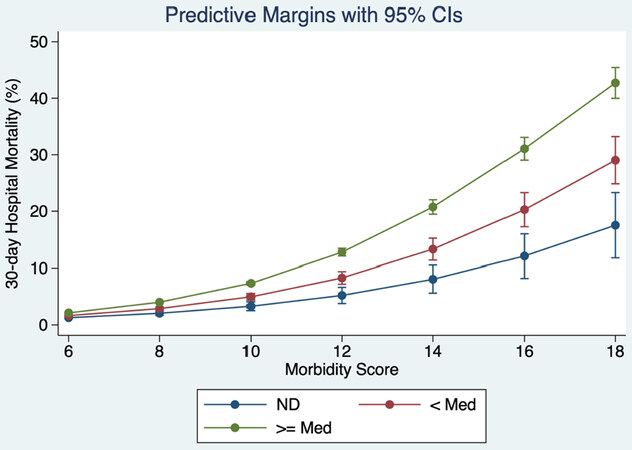
Figure 3. 30-day in-hospital mortality (per admission) related to Comorbidity Score and by hscTnT from the multivariable logistic regression model. The predicted probabilities were derived from and plotted based on the model prediction. Data was adjusted for Acute Illness Severity Score, Sepsis status and hscTnT category [not performed (ND) and hscTnT above or below median]
Do those with lower SES have greater risk?
We have previously reported that in general our patients with lower SES have worse outcomes[39,41]. We analysed, based on lower or higher SES, 30-day in-hospital mortality outcomes related to hscTnT. Admissions from high SES were older and with higher Comorbidity Score. Admissions from low SES areas had a median age of 66.4 years (IQR 48.2, 79.6) vs. 80.5 years (IQR: 65.6, 86.5) from higher SES areas. The data demonstrated, that irrespective of SES, the older patients from higher SES had worse outcomes [Figure 4] and that the predictive effect of hscTnT was not modulated by SES.
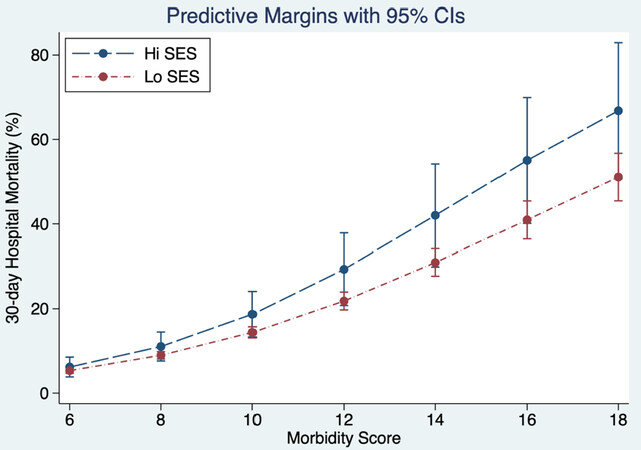
Figure 4. 30-day in-hospital mortality for patients with hscTnT ≥ 25 ng/L related to Comorbidity Score and SES from the multivariable logistic regression model. The predicted probabilities were derived from and plotted based on the model prediction. Data was adjusted for Acute Illness Severity Score, and Sepsis status. Higher SES patients (being older) had worse outcomes. SES: socioeconomic status
Discussion
Our study has demonstrated the prognostic value of hscTnT in emergency medical admissions. Patients with hscTnT ≥ 25 ng/L were more likely to have sepsis, high illness severity, and greater levels of comorbidity. Nonetheless, whether analysis was performed on the basis of an admission or unique patient basis, hscTnT was an independent predictor of 30-day in-hospital mortality in the multivariable model with a direct relationship to the level of hscTnT elevation. The decision to perform a hscTnT was associated with increased mortality although this observation mainly applied to high risk individuals; undertaking the test defined a risk group selected on clinical criteria or concern. Patients admitted from areas of low SES had better outcomes paradoxically, irrespective of Comorbidity Score, most likely because they were much younger in general compared to admissions from high SES areas.
Our results showed a clear relationship between the degree of hscTnT elevation and outcomes. Our data may then be seen to be quite different from other studies that have debated the significance of, and the level at which troponin elevation becomes a concern. These have focused on cut-points based on analysis of the literature. Khan et al.[42] performed a meta-analysis of 28 studies; the troponin T assays chose similar cut points (i.e., 0.1 ng/mL) to detect abnormal levels. This cut point was close to or greater than the threshold at which there is a 10% total coefficient of variance; it would be ~ 5-fold higher than the lower limit of detection. Arguments might revolve around a cutoff at the 99th percentile of a healthy reference population with a CV ≤ 10% or a cutoff value of 0.01 ug/L - the lowest value at which the coefficient of variation was ≤ 10%. It is therefore very surprising that our data shows not only that any troponin detection above the LOD carries prognostic significance, but selection of a group on the basis of a decision to perform a laboratory test - those with a hscTnT < 25 ng/L have higher risk than those who had no hscTnT test requested.
However, most previous studies have lacked the ability to measure two of the most important prognostic factors determining hospital survival - illness severity (measured by AISS in our study) and comorbidity (measured by the Comorbidity Score in our study). These two modifiers are of vital importance as prognostic indicators for a very good reason. The AISS, based on admission laboratory data, attempts to quantify homeostatic compensation and thereby relates an individual’s status at presentation to the clinical outcome. The fundamental principle relies on the assumption that failure to maintain the internal biochemical milieu, by mounting a counter-regulatory corrective response to a stressor, will have consequence - the extent of departure from the normal status being a measure of the ‘at risk’ status. Essentially, admission laboratory data is deployed to construct an illness severity score that is predictive of outcomes - AISS is the strongest predictive variable in the multivariable logistic model - OR 2.59 (95%CI: 2.25-2.98). A high comorbidity burden generally speaking is a less significant, but still important, problem in emergency admissions than AISS with an OR of 1.28 (95%CI: 1.25-1.30). The caveat is that the nature of the interaction between the AISS and Comorbidity Score (the threshold effect of the latter relative to mortality outcome lowers as the AISS increases) that one needs both to accurately compute risk. Many studies lack the ability to measure or adjust for such in multivariable logistic models, and so incorrectly attribute the risk of poor outcomes to the prognostic variable of interest.
Published studies on the prognostic value of troponin encompass a range of different clinical conditions[7-20], many of which are primary cardiac conditions such as congestive heart failure)[20], myocarditis[18], aortic stenosis[43] and atrial fibrillation without coronary disease[17]. Troponin has most obviously been shown to be a prognostic marker in myocardial infarction[44]. It is also a strong predictor in infective endocarditis with an OR of 3.4[45]. In 105,338 hospitalized heart failure admissions, Peacock et al.[46] determined troponin levels with 6.2% having positive troponin results; the adjusted OR for death with a positive troponin test was 2.55. In a meta-analysis of community based chronic heart failure patients, troponin T was associated with all-cause mortality with a hazard ratio of 1.48[47]. In surgical ICU patients, Relos et al.[48] reported that even moderately elevated troponin I levels - below the threshold to diagnose overt myocardial infarction, were associated with a higher mortality rate and longer hospital and ICU length of stay. A study in acute respiratory distress syndrome reported a high prevalence of elevated cardiac markers[49] and an associated increased 60-day mortality and organ failure. Thus, occult or subclinical myocardial disease could be implicated as a cause of death in acute respiratory distress syndrome. Other areas, where elevated troponin values have been demonstrated to be predictive of in-hospital mortality have included ischaemic stroke[50], intra-cerebral haemorrhage[51], gastro-intestinal haemorrhage[52], non-cardiac surgery[53], renal failure[54], and following renal transplant[55].
The strengths of our study include the large number of included patients, the comprehensive assessment of all admitted medical patients, and the collection of large volumes of relevant clinical data. The exclusion of patients admitted with ACS is another strength as risk stratification of patients with ACS has been well described and is a potential confounder in any study of this nature. As with any study, there are also potential limitations to our work. We have shown that hscTnT predicts outcome in our multivariable model after adjustment for known collected variables; it is possible that residual unknown or unmeasured confounders remain. This may even be a probable explanation for some of our results, particularly for the association between the performance of hscTnT and mortality, which is likely to be explained by unmeasured factors that are incorporated into the clinicians’ gestalt decision to perform a hscTnT test. Our study, while large, was performed in a single centre and the results will require external validation in other settings. We did not have the ability to assess the possibility that patients originally admitted to St. James’ may have subsequently been admitted to other hospitals; this may be particularly relevant for those resident outside our catchment area Additionally, we have examined the relationship in emergency medical admissions only; admissions under other disciplines may not necessarily demonstrate the same relationship. The demonstration of a relationship does not imply that the variable is amenable to intervention, nor does it follow that any attempted intervention may not have deleterious consequences[56].
In conclusion, we have demonstrated the prognostic value of hscTnT in emergency medical admissions. This suggests potential additive benefit to the inclusion of hscTnT in risk prediction models.
Declarations
AcknowledgmentsWe acknowledge the contributions of our consultant colleagues and the non-consultant members of the medical teams without which the AMAU initiative would not have been successful. The dedicated contributions of the clinical nurse managers, nurses, and allied health professionals in the AMAU is also gratefully acknowledged.
Authors’ contributionsMade substantial contributions to the conception and design of the study and performed data analysis and interpretation: Conway R, Byrne D, Cournane S, O’Riordan D, Coveney S, Silke B
Availability of data and materialsNot applicable.
Financial support and sponsorshipNone.
Conflicts of interestAll authors declared that there are no conflicts of interest.
Ethical approval and consent to participateThis study was approved by the institutional review board of St. James’s Hospital. Full ethics committee review was not required as this study used routinely collected, anonymised clinical data and no interventions were performed.
Consent for publicationNot applicable.
Copyright© The Author(s) 2020.
REFERENCES
1. Langlands A, Dowdle R, Elliott A, Gaddie J, Graham A, et al. RCPE UK Consensus Statement on Acute Medicine, November 2008. Br J Hosp Med (Lond) 2009;70:S6-7.
2. Hall MJ, Levant S, DeFrances CJ. Trends in Inpatient Hospital Deaths: National Hospital Discharge Survey, 2000-2010 2013. Available from: https://pdfs.semanticscholar.org/1ba6/6dde91e1ef7e8f7eb80da6423cf572bc24ce.pdf. [Last accessed on 7 Aug 2020].
3. Conway R, Byrne D, O’Riordan D, Silke B. Comparative influence of acute illness severity and comorbidity on mortality. Eur J Intern Med 2020;72:42-6.
4. Walsh JB, Coakley D, Murphy C, Coakley JD, Boyle E, et al. Demographic profile of the elderly population in Dublin accident and emergency hospital catchment areas. Ir Med J 2004;97:84-6.
6. Alpert JS, Thygesen K, Antman E, Bassand JP. Myocardial infarction redefined--a consensus document of The Joint European Society of Cardiology/American College of Cardiology Committee for the redefinition of myocardial infarction. J Am Coll Cardiol 2000;36:959-69.
7. Ammann P, Fehr T, Minder EI, Gunter C, Bertel O. Elevation of troponin I in sepsis and septic shock. Intensive Care Med 2001;27:965-9.
8. Baillard C, Boussarsar M, Fosse JP, Girou E, Le Toumelin P, et al. Cardiac troponin I in patients with severe exacerbation of chronic obstructive pulmonary disease. Intensive Care Med 2003;29:584-9.
9. Frankel WL, Herold DA, Ziegler TW, Fitzgerald RL. Cardiac troponin T is elevated in asymptomatic patients with chronic renal failure. Am J Clin Pathol 1996;106:118-23.
10. Giannitsis E, Muller-Bardorff M, Kurowski V, Weidtmann B, Wiegand U, et al. Independent prognostic value of cardiac troponin T in patients with confirmed pulmonary embolism. Circulation 2000;102:211-7.
11. Healey JS, Davies RF, Smith SJ, Davies RA, Ooi DS. Prognostic use of cardiac troponin T and troponin I in patients with heart failure. Can J Cardiol 2003;19:383-6.
12. James P, Ellis CJ, Whitlock RM, McNeil AR, Henley J, et al. Relation between troponin T concentration and mortality in patients presenting with an acute stroke: observational study. BMJ 2000;320:1502-4.
13. Kathiresan S, Servoss SJ, Newell JB, Trani D, MacGillivray TE, et al. Cardiac troponin T elevation after coronary artery bypass grafting is associated with increased one-year mortality. Am J Cardiol 2004;94:879-81.
14. Koutouzis M, Kontaras K, Sfyroeras G, Moulakakis K, Nikolidakis S, et al. Cardiac troponin I in patients with acute lower limb ischemia. Am J Cardiol 2007;100:728-30.
15. Moller N, Foss AC, Gravholt CH, Mortensen UM, Poulsen SH, et al. Myocardial injury with biomarker elevation in diabetic ketoacidosis. J Diabetes Complications 2005;19:361-3.
16. Nunes JP, Mota Garcia JM, Farinha RM, Carlos Silva J, et al. Cardiac troponin I in aortic valve disease. Int J Cardiol 2003;89:281-5.
17. Nunes JP, Silva JC, Maciel MJ. Troponin I in atrial fibrillation with no coronary atherosclerosis. Acta Cardiol 2004;59:345-6.
18. Smith SC, Ladenson JH, Mason JW, Jaffe AS. Elevations of cardiac troponin I associated with myocarditis. Experimental and clinical correlates. Circulation 1997;95:163-8.
19. Tung P, Kopelnik A, Banki N, Ong K, Ko N, et al. Predictors of neurocardiogenic injury after subarachnoid hemorrhage. Stroke 2004;35:548-51.
20. Waxman DA. Troponin I is an independent predictor of all-cause mortality in hospitalized patients with congestive heart failure. Am Heart J 2007;154:e27. author reply e9
21. Alcalai R, Planer D, Culhaoglu A, Osman A, Pollak A, et al. Acute coronary syndrome vs nonspecific troponin elevation: clinical predictors and survival analysis. Arch Intern Med 2007;167:276-81.
22. Rooney T, Moloney ED, Bennett K, O’Riordan D, Silke B. Impact of an acute medical admission unit on hospital mortality: a 5-year prospective study. QJM 2008;101:457-65.
23. Conway R, O’Riordan D, Silke B. Long-term outcome of an AMAU--a decade’s experience. Q J Med 2014;107:43-9.
24. Coary R, Byrne D, O’Riordan D, Conway R, Cournane S, et al. Does admission via an acute medical unit influence hospital mortality? 12 years’ experience in a large Dublin hospital. Acute Med 2014;13:152-8.
25. Conway R, Byrne D, O’Riordan D, Silke B. Outcomes in acute medicine - Evidence from extended observations on readmissions, hospital length of stay and mortality outcomes. Eur J Intern Med 2019;66:69-74.
26. Conway R, Byrne D, Cournane S, O’Riordan D, Silke B. Fifteen-year outcomes of an acute medical admission unit. Ir J Med Sci 2018;187:1097-105.
27. O’Loughlin R, Allwright S, Barry J, Kelly A, Teljeur C. Using HIPE data as a research and planning tool: limitations and opportunities. Ir J Med Sci 2005;174:40-5. discussion 52-7
28. O’Callaghan A, Colgan MP, McGuigan C, Smyth F, Haider N, et al. A critical evaluation of HIPE data. Ir Med J 2012;105:21-3.
29. Silke B, Kellett J, Rooney T, Bennett K, O’Riordan D. An improved medical admissions risk system using multivariable fractional polynomial logistic regression modelling. Q J Med 2010;103:23-32.
30. Courtney D, Conway R, Kavanagh J, O’Riordan D, Silke B. High-sensitivity troponin as an outcome predictor in acute medical admissions. Postgrad Med J 2014:1-7.
31. Chotirmall SH, Callaly E, Lyons J, O’Connell B, Kelleher M, et al. Blood cultures in emergency medical admissions: a key patient cohort. Eur J Emerg Med 2016;23:38-43.
32. Chotirmall SH, Picardo S, Lyons J, D’Alton M, O’Riordan D, et al. Disabling disease codes predict worse outcomes for acute medical admissions. Intern Med J 2014;44:546-53.
33. Kopelman PG, Sanderson AJ. Application of database systems in diabetes care. Med Inform (Lond) 1996;21:259-71.
34. Courtney D, Conway R, Kavanagh J, O’Riordan D, Silke B. High-sensitivity troponin as an outcome predictor in acute medical admissions. Postgrad Med J 2014;90:311-6.
35. Chin JL, O’Dowd S, Adnan WA, Bennett K, O’Riordan D, et al. Using the MDRD value as an outcome predictor in emergency medical admissions. Nephrol Dial Transplant 2011;26:3155-9.
36. Kelly A, Teljeur C. SAHRU National Deprivation Index Trinity College, Dublin 2007. Available from: http://www.sahru.tcd.ie/services/deprivation/DeprivationFiles/WebReport07.pdf. [Last accessed on 7 Aug 2020].
38. Conway R, Byrne D, O’Riordan D, Silke B. Emergency readmissions are substantially determined by acute illness severity and chronic debilitating illness: a single centre cohort study. Eur J Intern Med 2015;26:12-7.
39. Conway R, Galvin S, Coveney S, O’Riordan D, Silke B. Deprivation as an outcome determinant in emergency medical admissions. QJM 2013;106:245-51.
40. Conway R, Byrne D, O’Riordan D, Silke B. Comparative influence of acute illness severity and comorbidity on mortality. Eur J Intern Med 2020;72:42-6.
41. Conway R, Byrne D, O’Riordan D, Cournane S, Coveney S, et al. Deprivation index and dependency ratio are key determinants of emergency medical admission rates. Eur J Intern Med 2015;26:709-13.
42. Khan NA, Hemmelgarn BR, Tonelli M, Thompson CR, Levin A. Prognostic value of troponin T and I among asymptomatic patients with end-stage renal disease: a meta-analysis. Circulation 2005;112:3088-96.
43. Nunes JP, Mota Garcia JM, Farinha RM, Carlos Silva J, Magalhães D, et al. Cardiac troponin I in aortic valve disease. Int J Cardiol 2003;89:281-5.
44. Goriki Y, Tanaka A, Nishihira K, Kawaguchi A, Natsuaki M, et al. A novel predictive model for in-hospital mortality based on a combination of multiple blood variables in patients with ST-segment-elevation myocardial infarction. J Clin Med 2020;9:852.
45. Siciliano RF, Gualandro DM, Sommer Bittencourt M, Paixao M, Marcondes-Braga F, et al. Biomarkers for prediction of mortality in left-sided infective endocarditis. Int J Infect Dis 2020;96:25-30.
46. Peacock WF, De Marco T, Fonarow GC, Diercks D, Wynne J, et al. Cardiac troponin and outcome in acute heart failure. N Engl J Med 2008;358:2117-26.
47. Aimo A, Januzzi JL Jr, Vergaro G, Ripoli A, Latini R, et al. Prognostic value of high-sensitivity troponin T in chronic heart failure: an individual patient data meta-analysis. Circulation 2018;137:286-97.
48. Relos R, Hasinoff I, Beilman G. Moderately elevated serum troponin concentrations are associated with increased morbidity and mortality rates in surgical intensive care unit patients. Critical Care Medicine 2003;31:2598-603.
49. Bajwa E, Boyce P, Januzzi J, Gong M, Thompson B, et al. Biomarker evidence of myocardial cell injury is associated with mortality in acute respiratory distress syndrome. Crit Care Med 2007;35:2484-90.
50. Csecsei P, Pusch G, Ezer E, Berki T, Szapary L, et al. Relationship between cardiac troponin and thrombo-inflammatory molecules in prediction of outcome after acute ischemic stroke. J Stroke Cerebrovasc Dis 2018;27:951-6.
51. He Y, Liu Q, Wang J, Wang DW, Ding H, et al. Prognostic value of elevated cardiac troponin I in patients with intracerebral hemorrhage. Clin Cardiol 2020;43:338-45.
52. Vasile V, Babuin L, Perez J, Alegria J, Song L, et al. Long-term prognostic significance of elevated cardiac troponin levels in critically ill patients with acute gastrointestinal bleeding. Crit Care Med 2009;37:140-7.
53. Humble CAS, Huang S, Jammer I, Bjork J, Chew MS. Prognostic performance of preoperative cardiac troponin and perioperative changes in cardiac troponin for the prediction of major adverse cardiac events and mortality in noncardiac surgery: a systematic review and meta-analysis. PLoS One 2019;14:e0215094.
54. Otsuka K, Nakanishi K, Shimada K, Nakamura H, Inanami H, et al. Ankle-brachial index, arterial stiffness, and biomarkers in the prediction of mortality and outcomes in patients with end-stage kidney disease. Clin Cardiol 2019;42:656-62.
55. Firth C, Kaur T, Chakkera H, Zhang N, Shamoun F, et al. Cardiac troponin t and right ventricular systolic pressure predict cardiovascular and mortality risk in kidney transplant candidates. Am J Nephrol 2019;50:434-43.
Cite This Article
Export citation file: BibTeX | RIS
OAE Style
Conway R, Byrne D, Cournane S, O’Riordan D, Coveney S, Silke B. Troponin status predicts 30-day in-hospital mortality. Vessel Plus 2020;4:25. http://dx.doi.org/10.20517/2574-1209.2020.19
AMA Style
Conway R, Byrne D, Cournane S, O’Riordan D, Coveney S, Silke B. Troponin status predicts 30-day in-hospital mortality. Vessel Plus. 2020; 4: 25. http://dx.doi.org/10.20517/2574-1209.2020.19
Chicago/Turabian Style
Conway, Richard, Declan Byrne, Seán Cournane, Deirdre O’Riordan, Seamus Coveney, Bernard Silke. 2020. "Troponin status predicts 30-day in-hospital mortality" Vessel Plus. 4: 25. http://dx.doi.org/10.20517/2574-1209.2020.19
ACS Style
Conway, R.; Byrne D.; Cournane S.; O’Riordan D.; Coveney S.; Silke B. Troponin status predicts 30-day in-hospital mortality. Vessel Plus. 2020, 4, 25. http://dx.doi.org/10.20517/2574-1209.2020.19
About This Article
Copyright

Data & Comments
Data
0

 Cite This Article 0 clicks

 Like This Article 28
likes
Like This Article 28
likes


Comments
Comments must be written in English. Spam, offensive content, impersonation, and private information will not be permitted. If any comment is reported and identified as inappropriate content by OAE staff, the comment will be removed without notice. If you have any queries or need any help, please contact us at support@oaepublish.com.